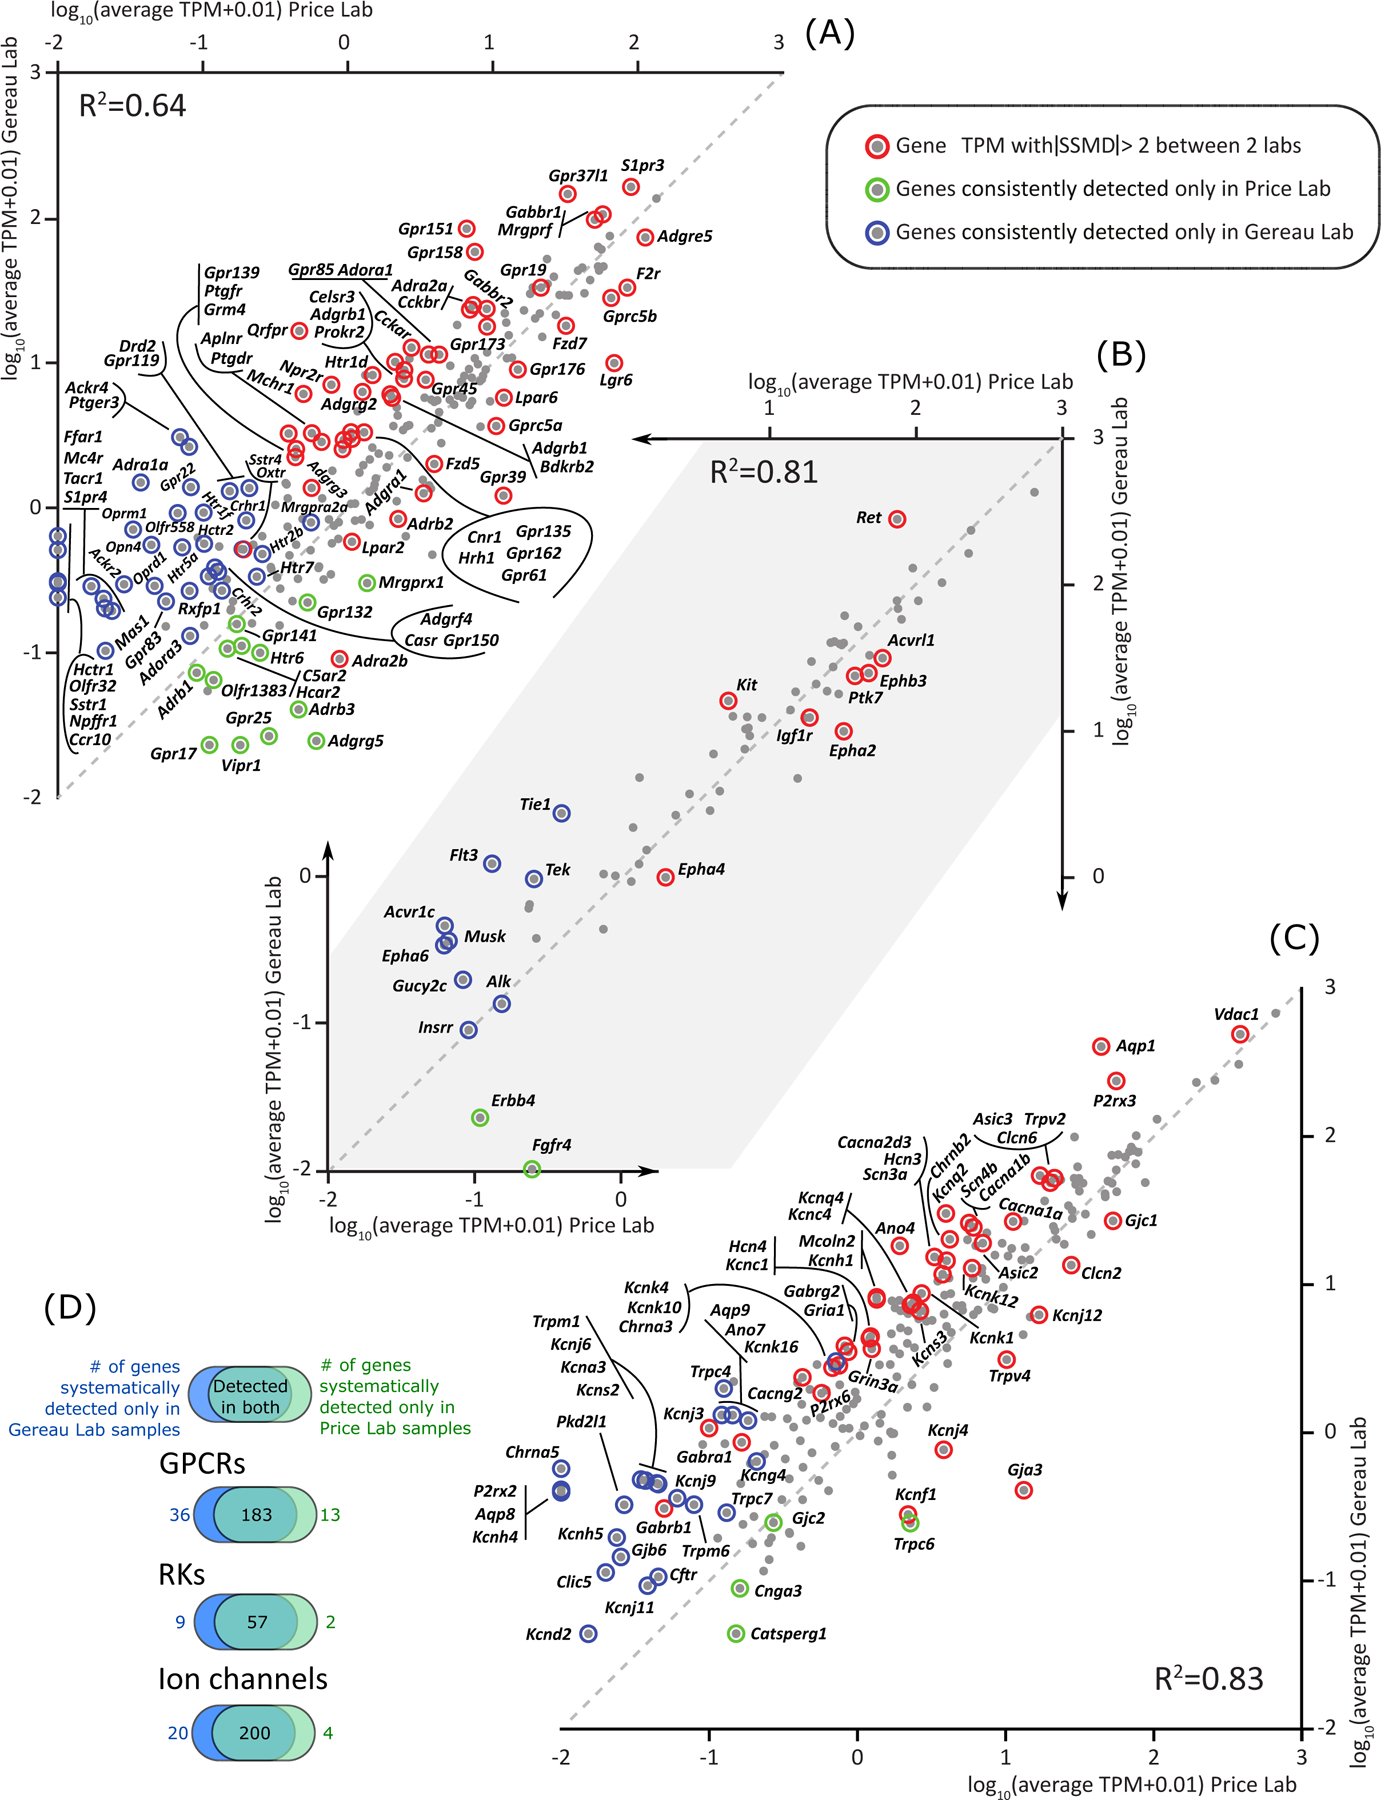
Figure 2.

Scatter plot and Venn diagrams showing a small amount of differential expression of GPCR genes (A), RK genes (B), and ion channel genes (C) in culture between the Price and Gereau laboratories. The number of genes consistently detected in RNA-sequencing assays for each laboratory are shown in Venn diagrams separated by gene families in (D). Expression levels of genes in all three families showed consistent correlation between the two laboratories: GPCR genes : Pearson’s R squared: 0.64, p < 0.01, RK genes : Pearson’s R squared: 0.81, p < 0.01, ion channel genes : Pearson’s R squared: 0.83, p < 0.01. Genes like Alk and Insrr are plotted on the diagonal, but marked as consistently detected only in Gereau laboratory samples. This is because they have comparable mean TPMs in samples from both laboratories, but are only consistently detected (in 5 or more samples out of 6) in the Gereau laboratory.
