
Figure 3. DNA-reactive B cells in Dnase1l3−/− mice develop primarily through ExFO differentiation into plasmablasts.
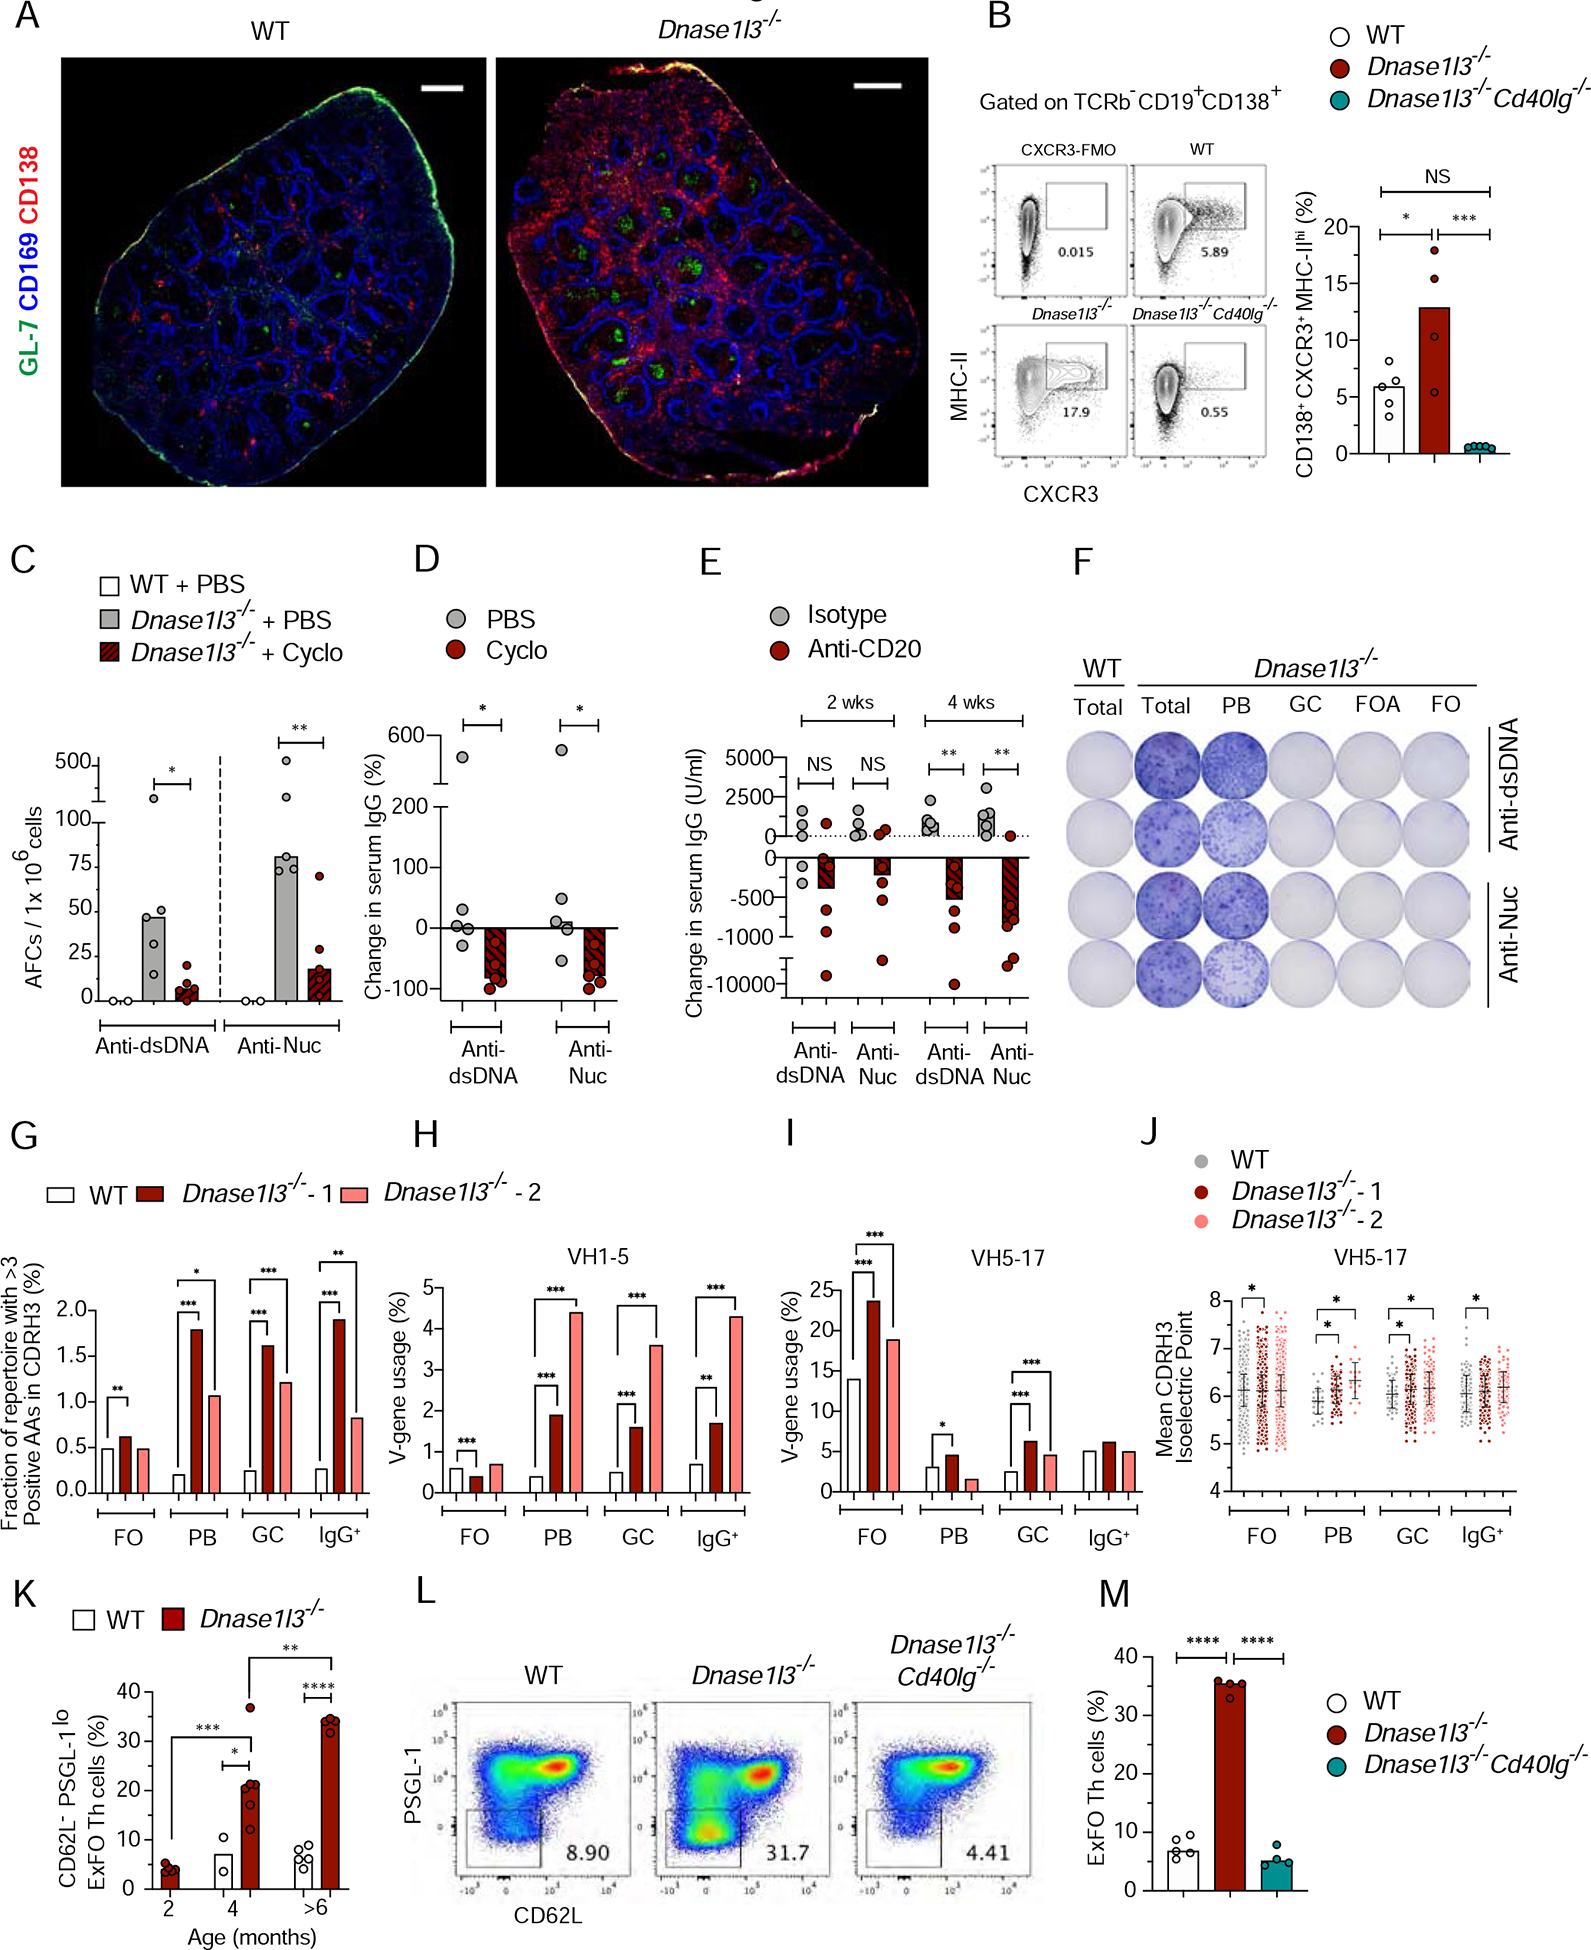
(A) Spleen sections representative of 3–5 WT or Dnase1l3−/− mice stained for CD138 (red), CD169 (blue) and GL-7 (green). Scale bar, 1000μm.
(B) Shown are representative flow plots and quantitation of the fraction of CXCR3+MHC-IIhi (ExFO) B cells, pre-gated on splenic TCRβ−B220+CD19+CD138+ cells from WT (open symbols), Dnase1l3−/− (red) and Dnase1l3−/−Cd40lg−/− (green) mice. CXCR3-FMO (fluorescence minus one) was used for gate allocation.
(C, D) Frequency of anti-dsDNA, and anti-nucleosome (Nuc) antibody-forming cells (AFCs), determined by ELISpot (C); and percent change in serum anti-dsDNA or antiNuc IgG titers determined by ELISA (D), in 6-mo-old WT mice (open) or Dnase1l3−/− mice treated with PBS (grey) or cyclophosphamide (cyclo, red).
(E) Change in serum titers of anti-dsDNA or anti-Nuc IgG in 6-mo-old Dnase1l3−/− mice after one dose (100μg/ mouse; i.p.) of treatment with IgG2a isotype control (grey) or anti-CD20 Ab (red) at 2 weeks and upon second dose of a similar treatment at 4 weeks.
(F) Image of ELISpot plate representative of 2 experiments with two mice per experiment. Shown are two serial dilutions of anti-dsDNA, and anti-nucleosome (Nuc) antibody-forming cells (AFCs) from total splenocytes of >6-mo-old WT and Dnase1l3−/− mice OR from flow sorted – Plasmablasts (PB); Germinal center B cells (GC); Follicular activated B cells (FOA) and Naïve Follicular B cells (FO) from >6 mo old Dnase1l3−/− mice. Sorted GC, FOA and FO cells were activated for 2h with 5 μg/ml anti-CD40 + 1 μg/ml LPS, and plated onto DNA or Nuc coated ELISpot plates.
(G) Percentage of clonotypes in each repertoire that contain >3 positively charged amino acids (AA) within the CDR-H3 region, in FO, PB, GC and IgG+ B cells from WT (open), Dnase1l3−/− −1 (red) and Dnase1l3−/− −2 (salmon).
(H, I) Percentage of clonotypes that use the V-gene IGHV1–5 (H), and V-gene IGH5–17 (I) in the indicated B cell subsets and mice.
(J) Mean isoelectric point of the CDR-H3 region among the clonotypes that use the V-gene IGH5–17. Each point represents one clonotype. Error bars represent the mean and S.D. of all clonotypes in each group.
(K) Flow analysis of the fraction of CD62L−PSGL-1loExFO Th cells among splenic B220TCRβ+CD4+ T cells of WT and Dnase1l3−/− mice at the indicated ages.
(L, M) Representative flow plots of pre-gated splenic B220−TCRβ+CD4+ cells with low ExFO Th cells shown within the gate (L); quantitation of the fraction of ExFO Th cells (M) from >6-mo-old WT, Dnase1l3−/− and Dnase1l3−/−Cd40lg−/− mice.
For panels A-E, K and M symbols represent individual mice and bars indicate median.
* p ≤ 0.05, ** p ≤ 0.01, ***p ≤ 0.001 and **** p ≤ 0.0001.
See also Figure S3.