
Figure 1. CRISPR screen results and molecular profiles.
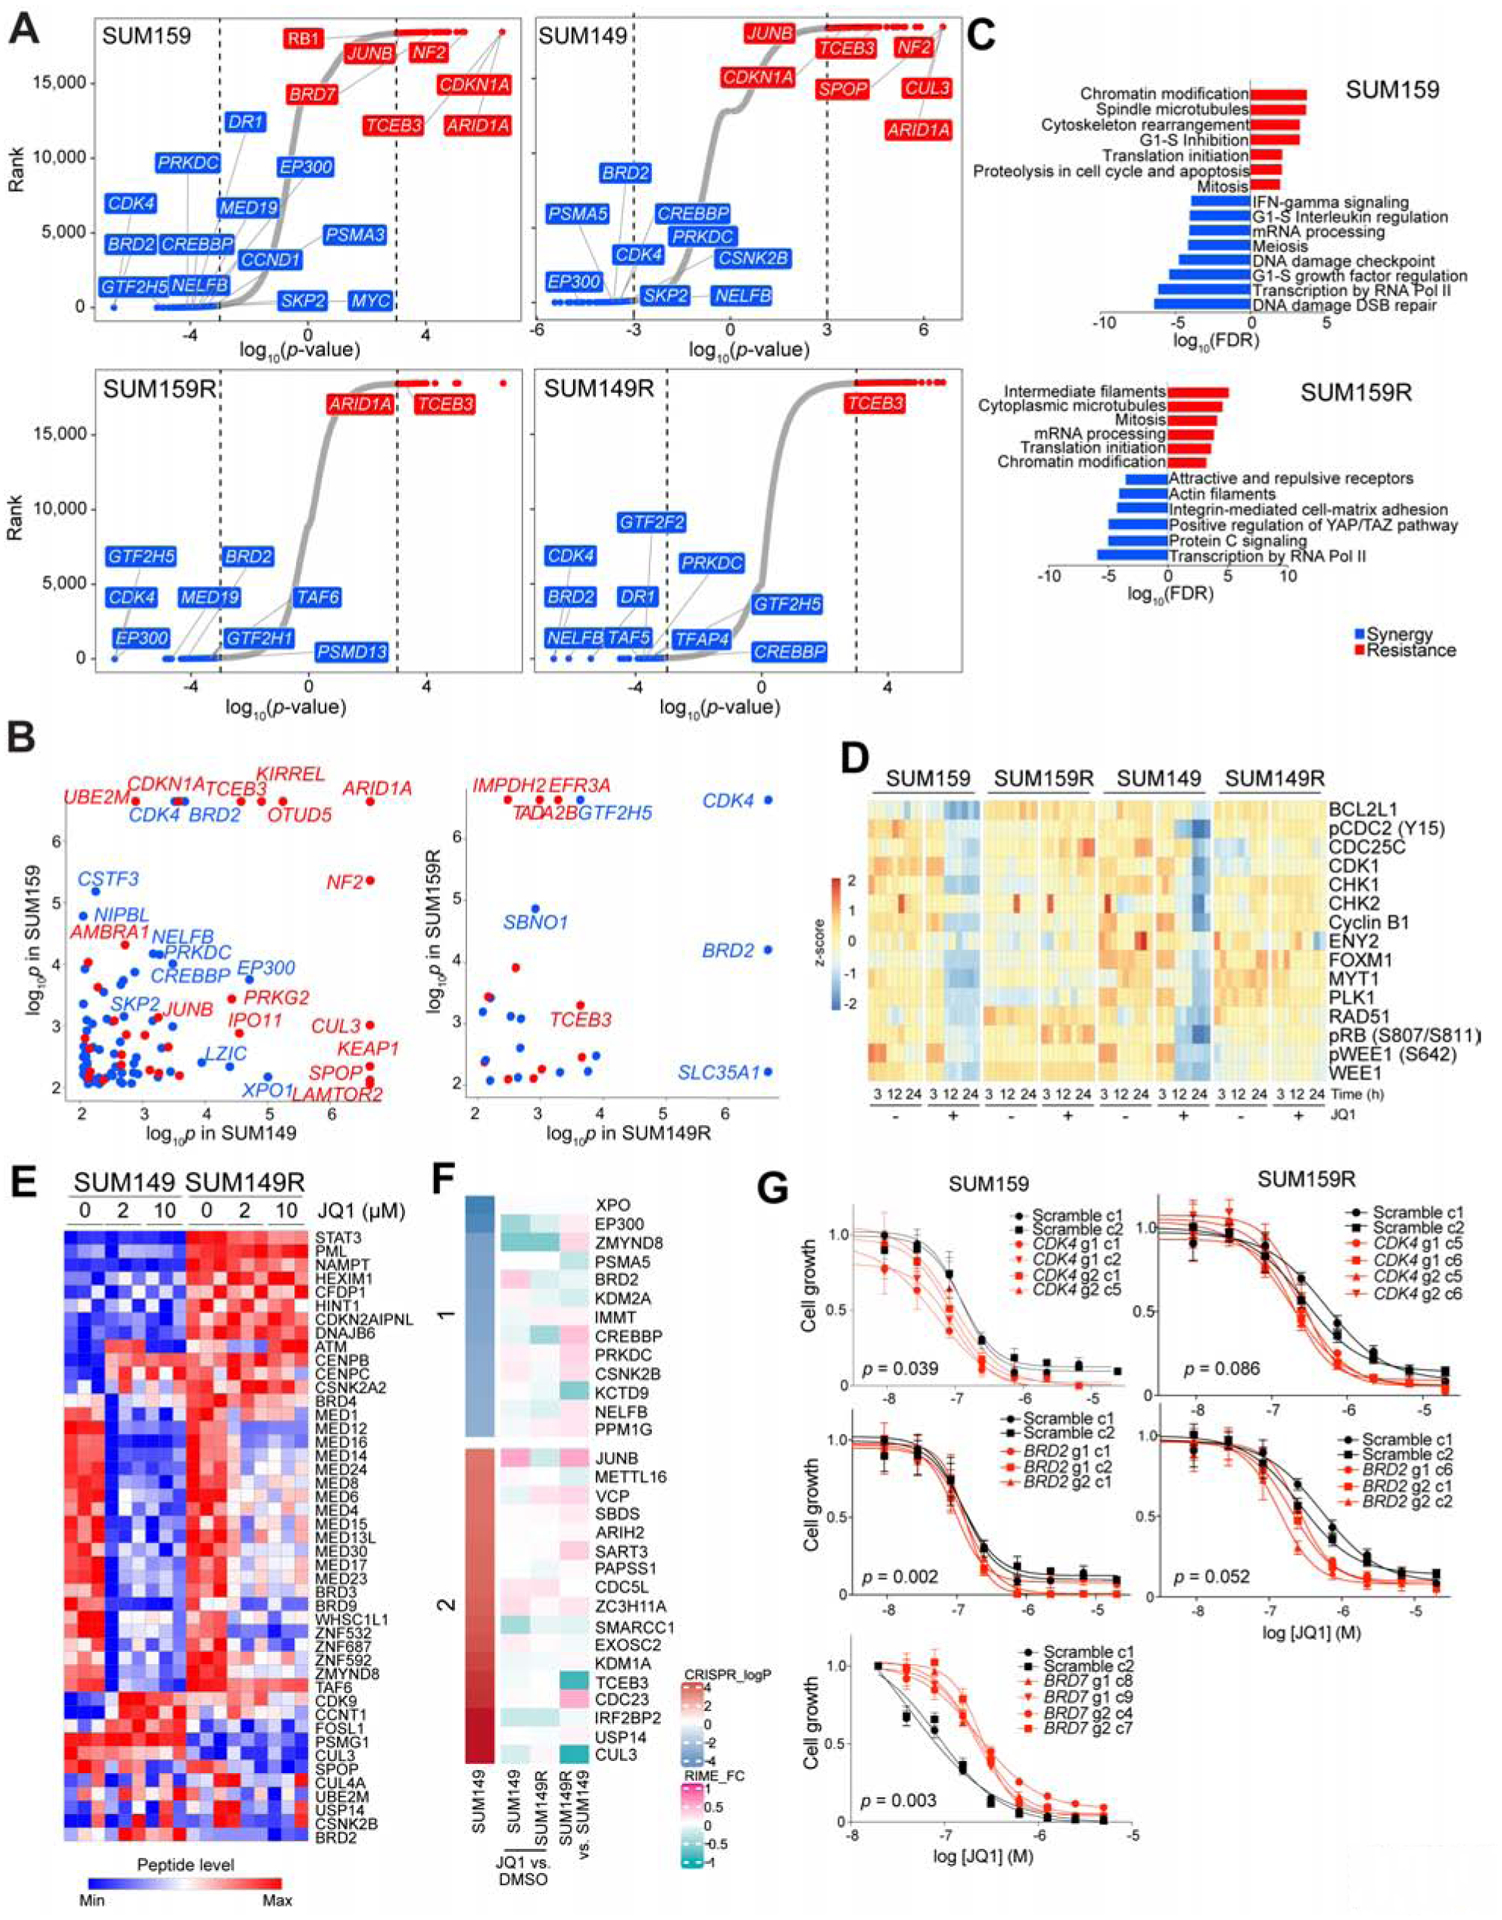
(A) Top hit genes in the CRISPR screen revealed by comparing untreated vs. JQ1-treated cells. Genes are ranked by log10(p-values) defined by MAGeCK. Significant resistance and synthetic lethal hits (p-value < 0.001) are marked in red and blue, respectively. (B) Comparison of CRISPR screen hits between the indicted cell lines. Genes with p-values < 0.001 in both cell lines are shown. (C) Top process networks enriched in CRISPR screen hits. (D) Heatmap of Cluster 8 in RPPA data representing proteins downregulated after JQ1 treatment in parental but not in BBDI-resistant cells. (E) Heatmap of BRD4 RIME data in SUM149 and SUM149R cells −/+ 3h JQ1 treatment at the indicated doses. (F) Heatmap of significant resistant (red) and synthetic lethal (blue) hits CRISPR screen hits and their BRD4 binding changes revealed by RIME in SUM149 and SUM149R cells in JQ1 compared to DMSO and in SUM149R compared to SUM149 cells. (G) Dose response curves of JQ1 of scramble or gene-specific sgRNA-expressing single cell clones derived from the indicated cell lines. See also Figures S1–3, and Tables S1–3.