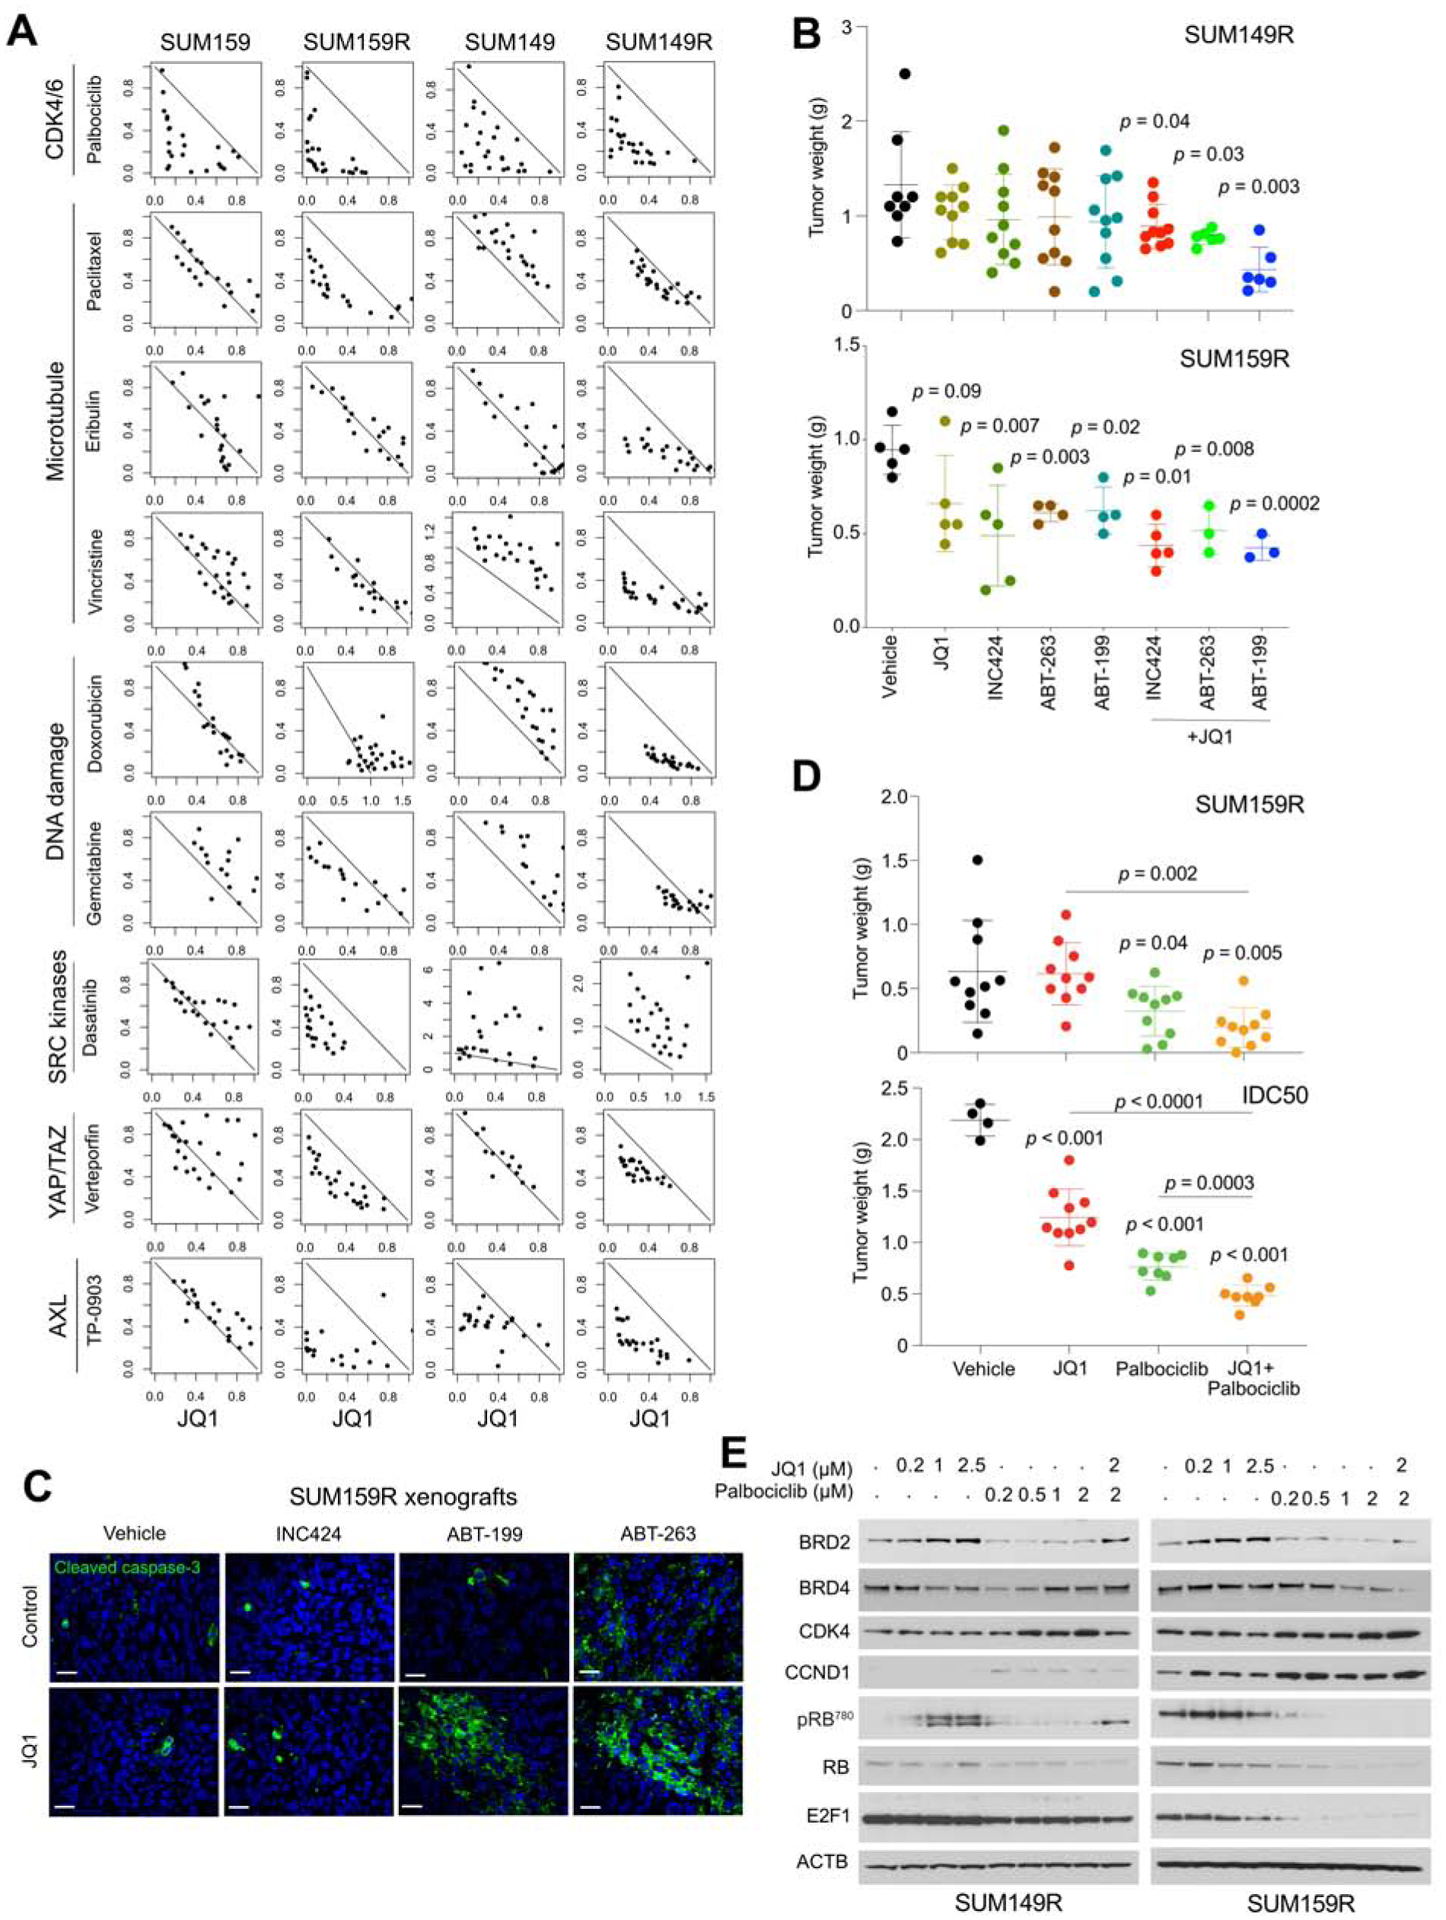
Figure 3. Validation of synthetic lethal interactions with JQ1.

(A) Synergy studies of JQ1 with various inhibitors in cell culture. Points represent paired values of drug concentrations assessed for synergism (see Methods). The diagonal line signifies drug additivity. Points above and below the line represent antagonistic and synergistic drug combinations, respectively. (B) Plots show xenograft weights after treatment with JQ1 and other drugs alone and in combinations. P-values indicate the statistical significance of differences compared to vehicle based on t-tests. (C) Immunofluorescence analysis of cleaved caspase-3 in SUM159R xenografts after single and combination treatments. Scale bars represent 50 μm. (D) Plots show xenograft weights after treatment with JQ1 and palbociclib, alone and in combination. (E) Immunoblot analysis of indicated proteins in SUM149R and SUM159R cells treated with the indicated doses of JQ1, palbociclib, and their combination for 12 hrs. See also Figure S4.
