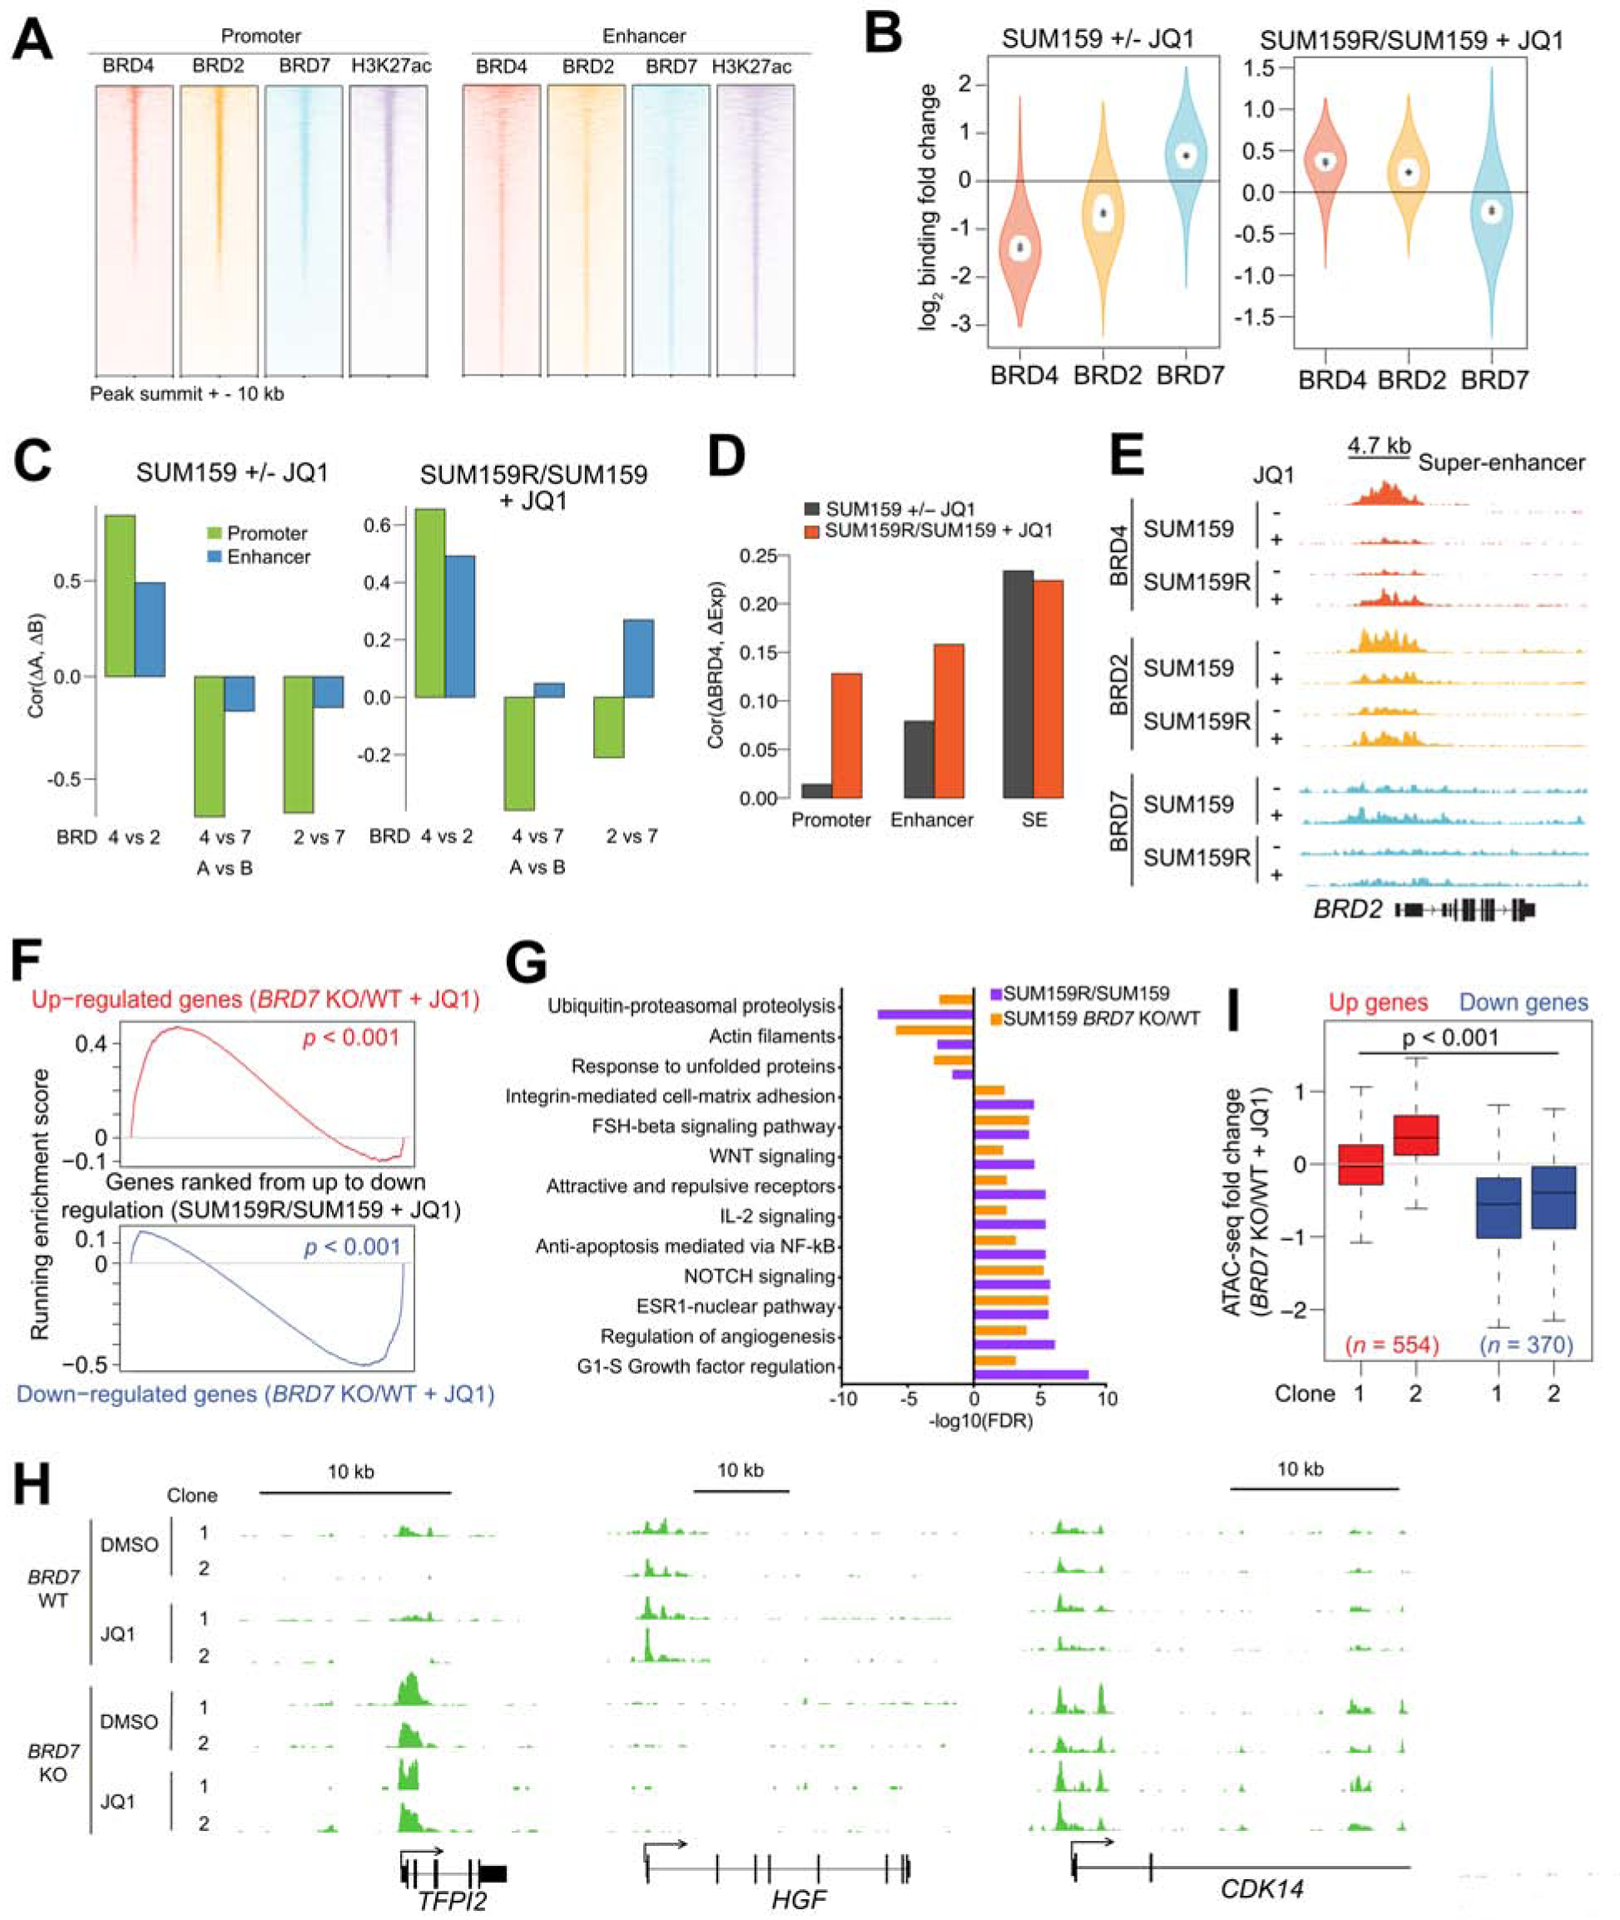
Figure 5. BRD4, BRD2 and BRD7 binding changes and their effects upon JQ1 treatment.

(A) ChIP-seq binding enrichment of BRD4, BRD2, BRD7, and H3K27ac in promoter and enhancer regions in SUM159 cells. (B) BRD4, BRD2, and BRD7 ChIP-seq binding changes between JQ1-treated (+JQ1) and untreated (−JQ1) SUM159 cells and between JQ1-treated resistant (SUM159R) and parental cells. Outer violin indicates the entire distribution, inner violin (white) indicates the IQR, and “.” and “+” indicate the median and mean, respectively. (C) Pairwise correlations of BRD4, BRD2, and BRD7 ChIP-seq binding changes in promoter and enhancer regions. (D) Correlations of BRD4 binding changes in promoter, enhancer, and SE regions and their gene expression changes. (E) Gene tracks depicting BRD4, BRD2, and BRD7 signal at the BRD2 locus. (F) Gene set enrichment analysis (GSEA) depicting the relationship between expression of genes in JQ1-treated BRD7 KO cells and JQ1-treated resistant cells. (G) Top process networks enriched in differentially expressed genes between JQ1-treated BRD7 wild type (WT) and BRD7 knockout (KO) SUM159 cells and between JQ1-treated SUM159R and SUM159 cells. (H) Gene tracks depicting ATAC-seq signal at selected genomic loci in SUM159 BRD7 WT and KO cells. (I) Association between ATAC-seq binding changes and gene expression changes in two JQ1-treated BRD7 KO clones compared with JQ1-treated WT SUM159 cells. See also Figure S5 and Table S5.
