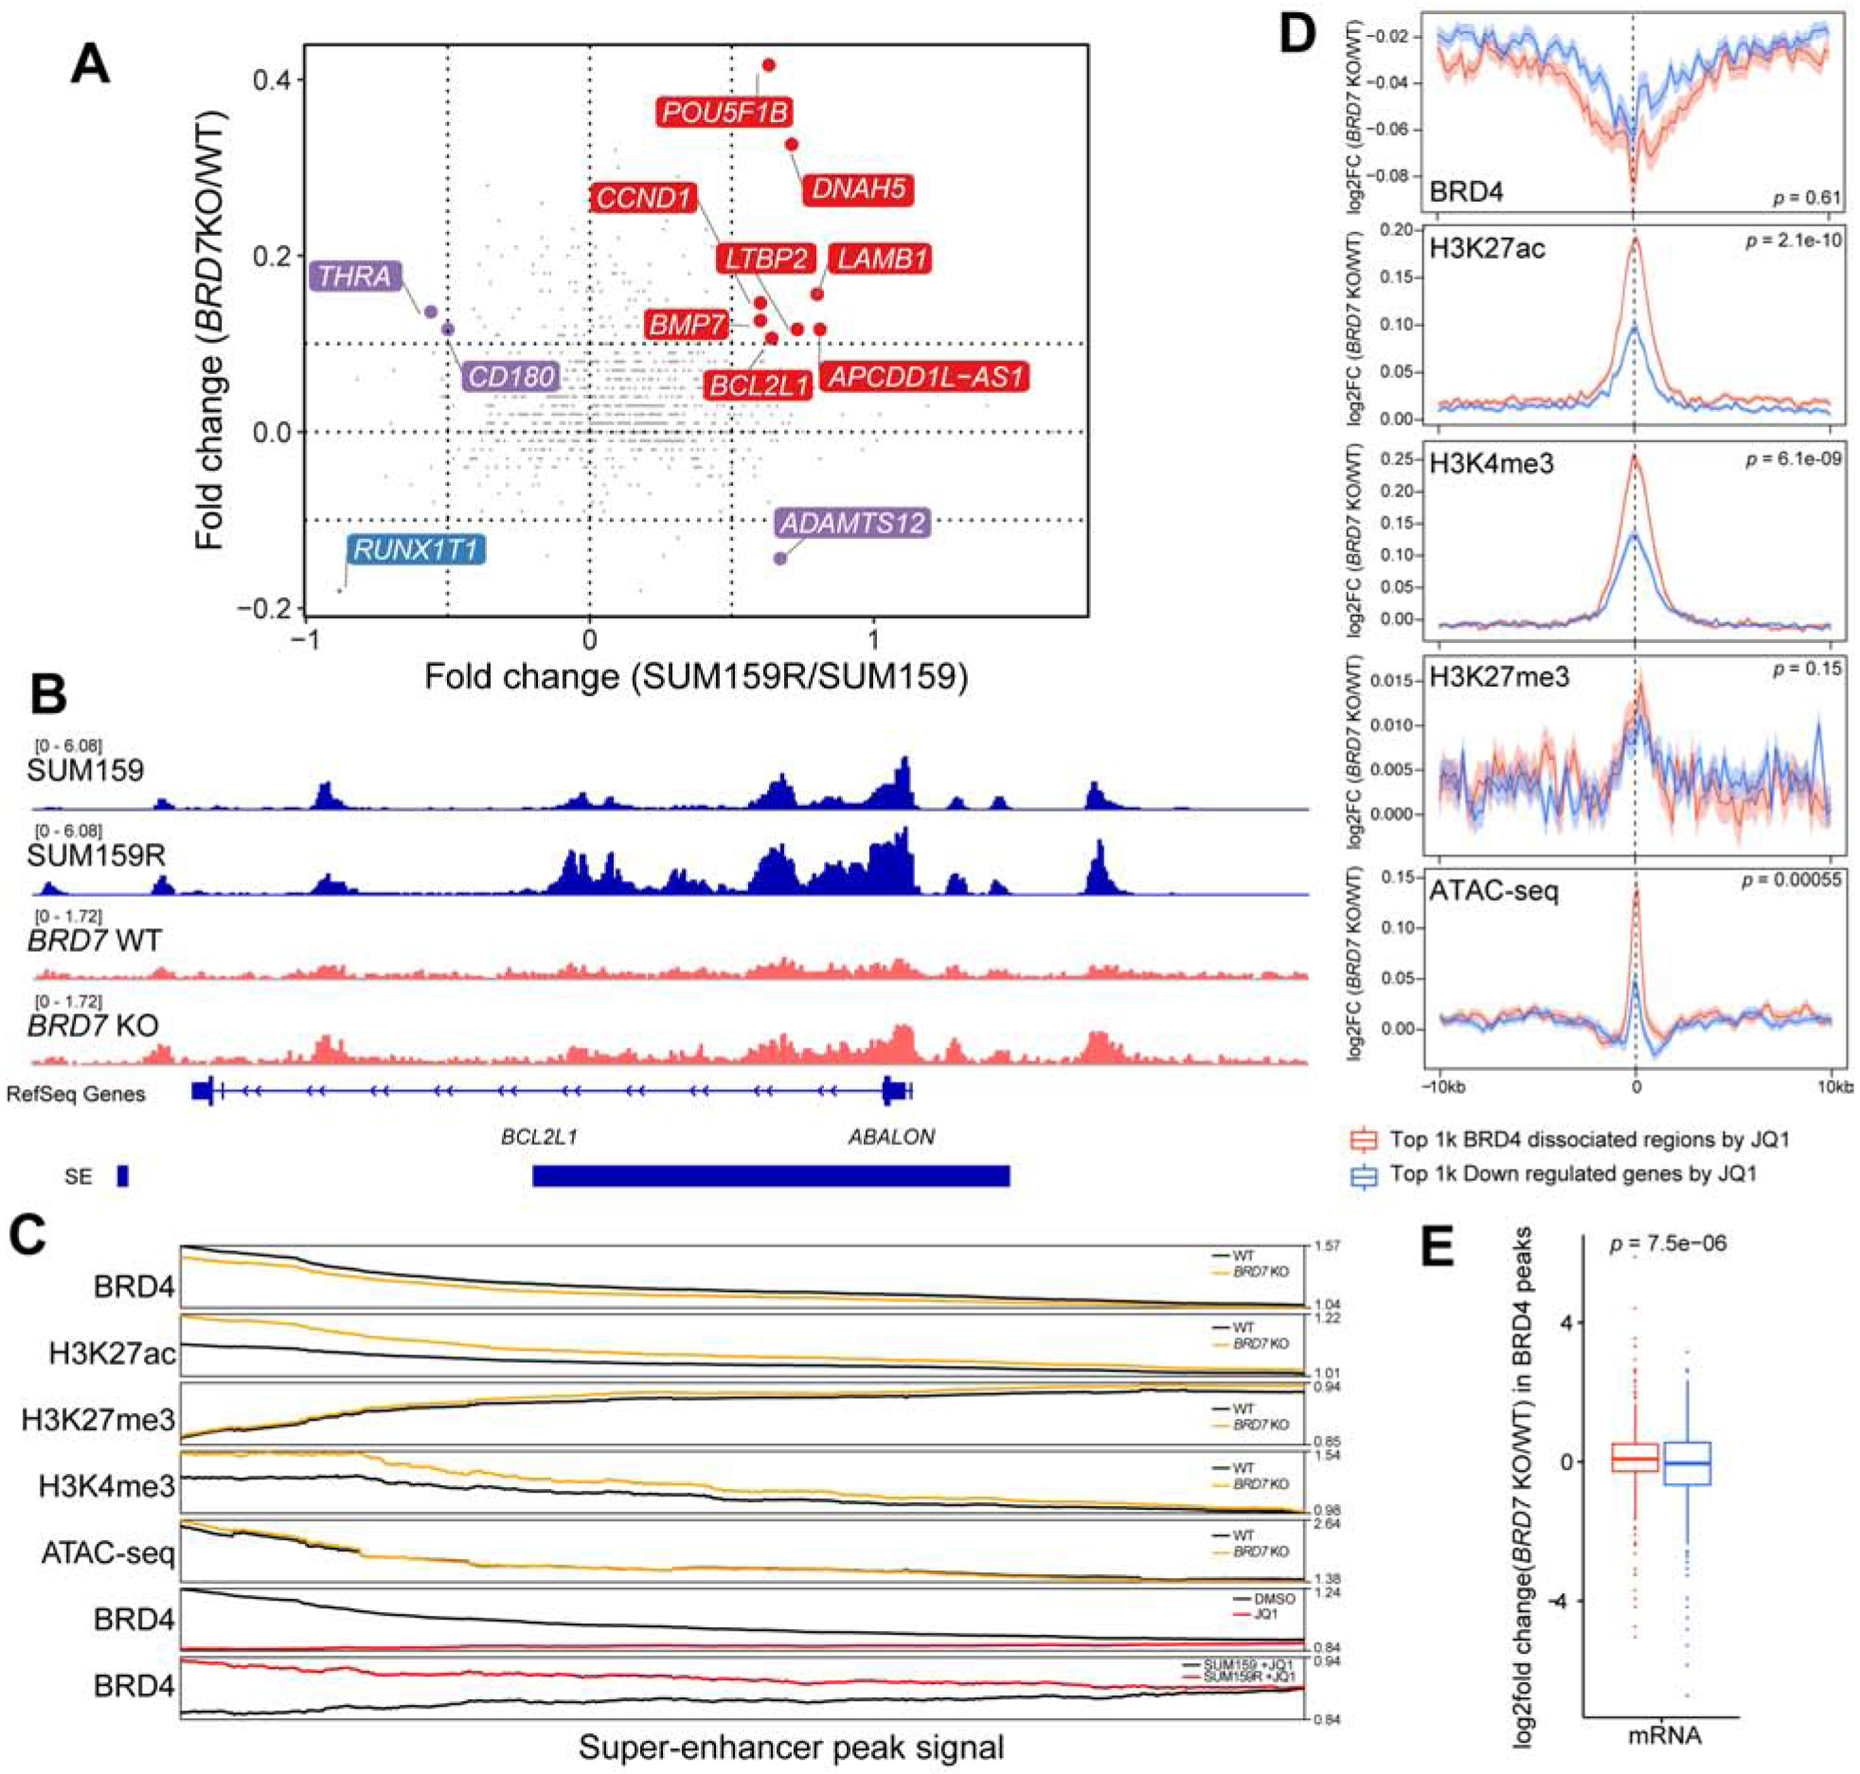
Figure 6. The effects of BRD7 deletion on BRD4 binding and histone modification patterns.

(A) Changes in SEs upon BRD7 knockout and between JQ1 sensitive and resistant SUM159 cells. Red is the co-activated super enhancers; blue is co-repressed super enhancers. Purple is the discrepant regulated super enhancers. (B) Example for a differential H3K27ac signal in a SE region. Normalized H3K27ac ChIP-seq signals (Reads Per Million) are shown as tracks using IGV. (C) Line plot shows smoothed signal of BRD4, H3K27ac, H3K27me3, and H3K4me3 ChIP-seq and ATAC-seq in BRD7 knockout and scramble SUM159 cells at SEs, and comparison to that of BRD4 ChIP-seq signal in DMSO, JQ1-treated and JQ1-resistant SUM159 cells (bottom two tracks). SEs are ranked by the fold change of BRD4 signal between +/− JQ1 from high (left) to low (right). (D) Changes in BRD4, H3K27ac, H3K27me3, H3K4me3, and ATAC-seq signal at top 1,000 BRD4 binding sites sensitive to JQ1 in SUM159 cells (red) and at top 1,000 genes downregulated by JQ1 in SUM159 cells (blue). ChIP-seq signals on peak summit +/− 10kb region. (E) Changes in mRNA levels at BRD4 peaks differential between BRD7 KO and WT cells at top 1,000 BRD4 binding sites sensitive to JQ1 in SUM159 cells (red) and at top 1,000 genes downregulated by JQ1 in SUM159 cells (blue). See also Figures S6.
