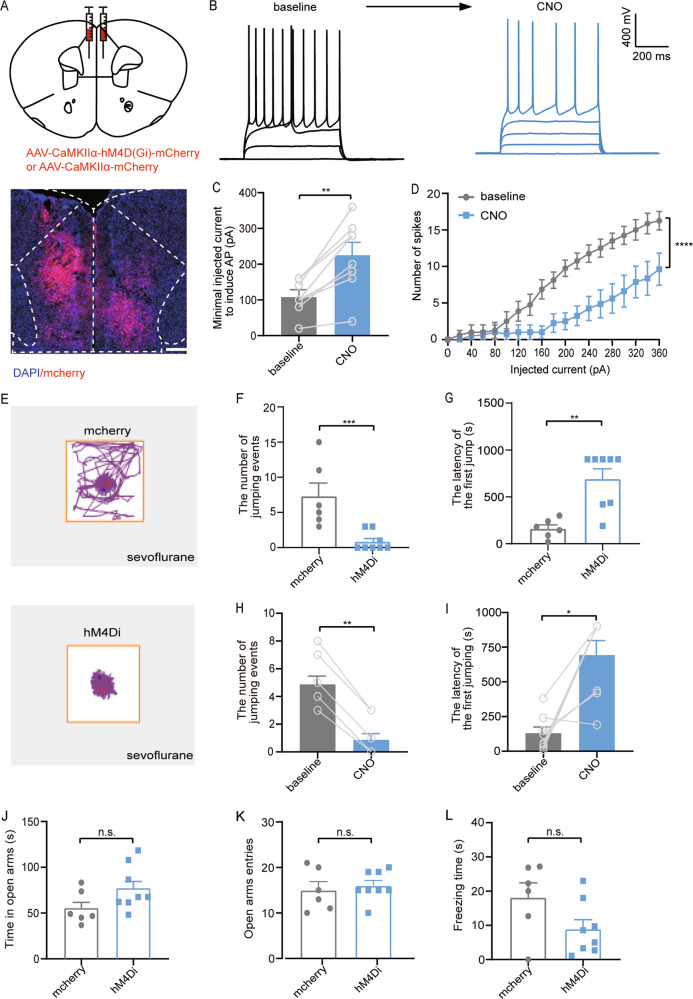
Fig. 4. Chemogenetic inhibition of neurons in the mPFC attenuates the sevoflurane-induced impulsive performance.
a Schematic diagram showing the target of viral injection (top). Location of the bilaterally viral hM4D (Gi) expression (red) in mPFC under control of the CaMKIIα promoter (bottom). b Current–voltage relationship of a representative mPFC neuron recorded before and during 5 μM CNO perfusion. Raw traces show individual voltage responses to a series of 600-ms current pulses from 0 to 360 pA with 20 pA steps. c The minimal injected current to induce action potential (AP) is increased by CNO. (n = 10; Paired Student’s t test). d The number of induced action potentials at different current steps. (n = 10; two-way ANOVA, Bonferroni multiple comparison post hoc tests). e Representative movement traces showing the locations of mcherry group (top) and hM4Di group (bottom) sevoflurane-exposure mice in a CAR test following CNO (1 mg/kg) administration. f, g Quantification of the number of cumulative jumping events (left) and the latency (right) of the mcherry group and hM4Di group. (n = 6, 8 for mcherry, hM4Di group respectively; Mann–Whitney U test). h, i Quantification of the number of cumulative jumping events (left) and the latency (right) of the baseline group and hM4Di group. (n = 8 for each group; Wilcoxon matched-pairs signed-rank test). j–l Quantification of the EPM results of the time spent in the open arms, open arms entries, freezing time of hM4Di and mcherry group after chemogenetic inhibition of mPFC glutamatergic neurons. (n = 6, 8 for mcherry, hM4Di group, respectively; Unpaired Student’s t test). Data = mean ± SEM; n.s. no significance, *P < 0.05, **P < 0.01, ***P < 0.001, ****P < 0.0001.

