
Extended Data Fig. 5 |. expression of mGFP positive cells in the Cspg4-CreERt; mT/mG CNS.
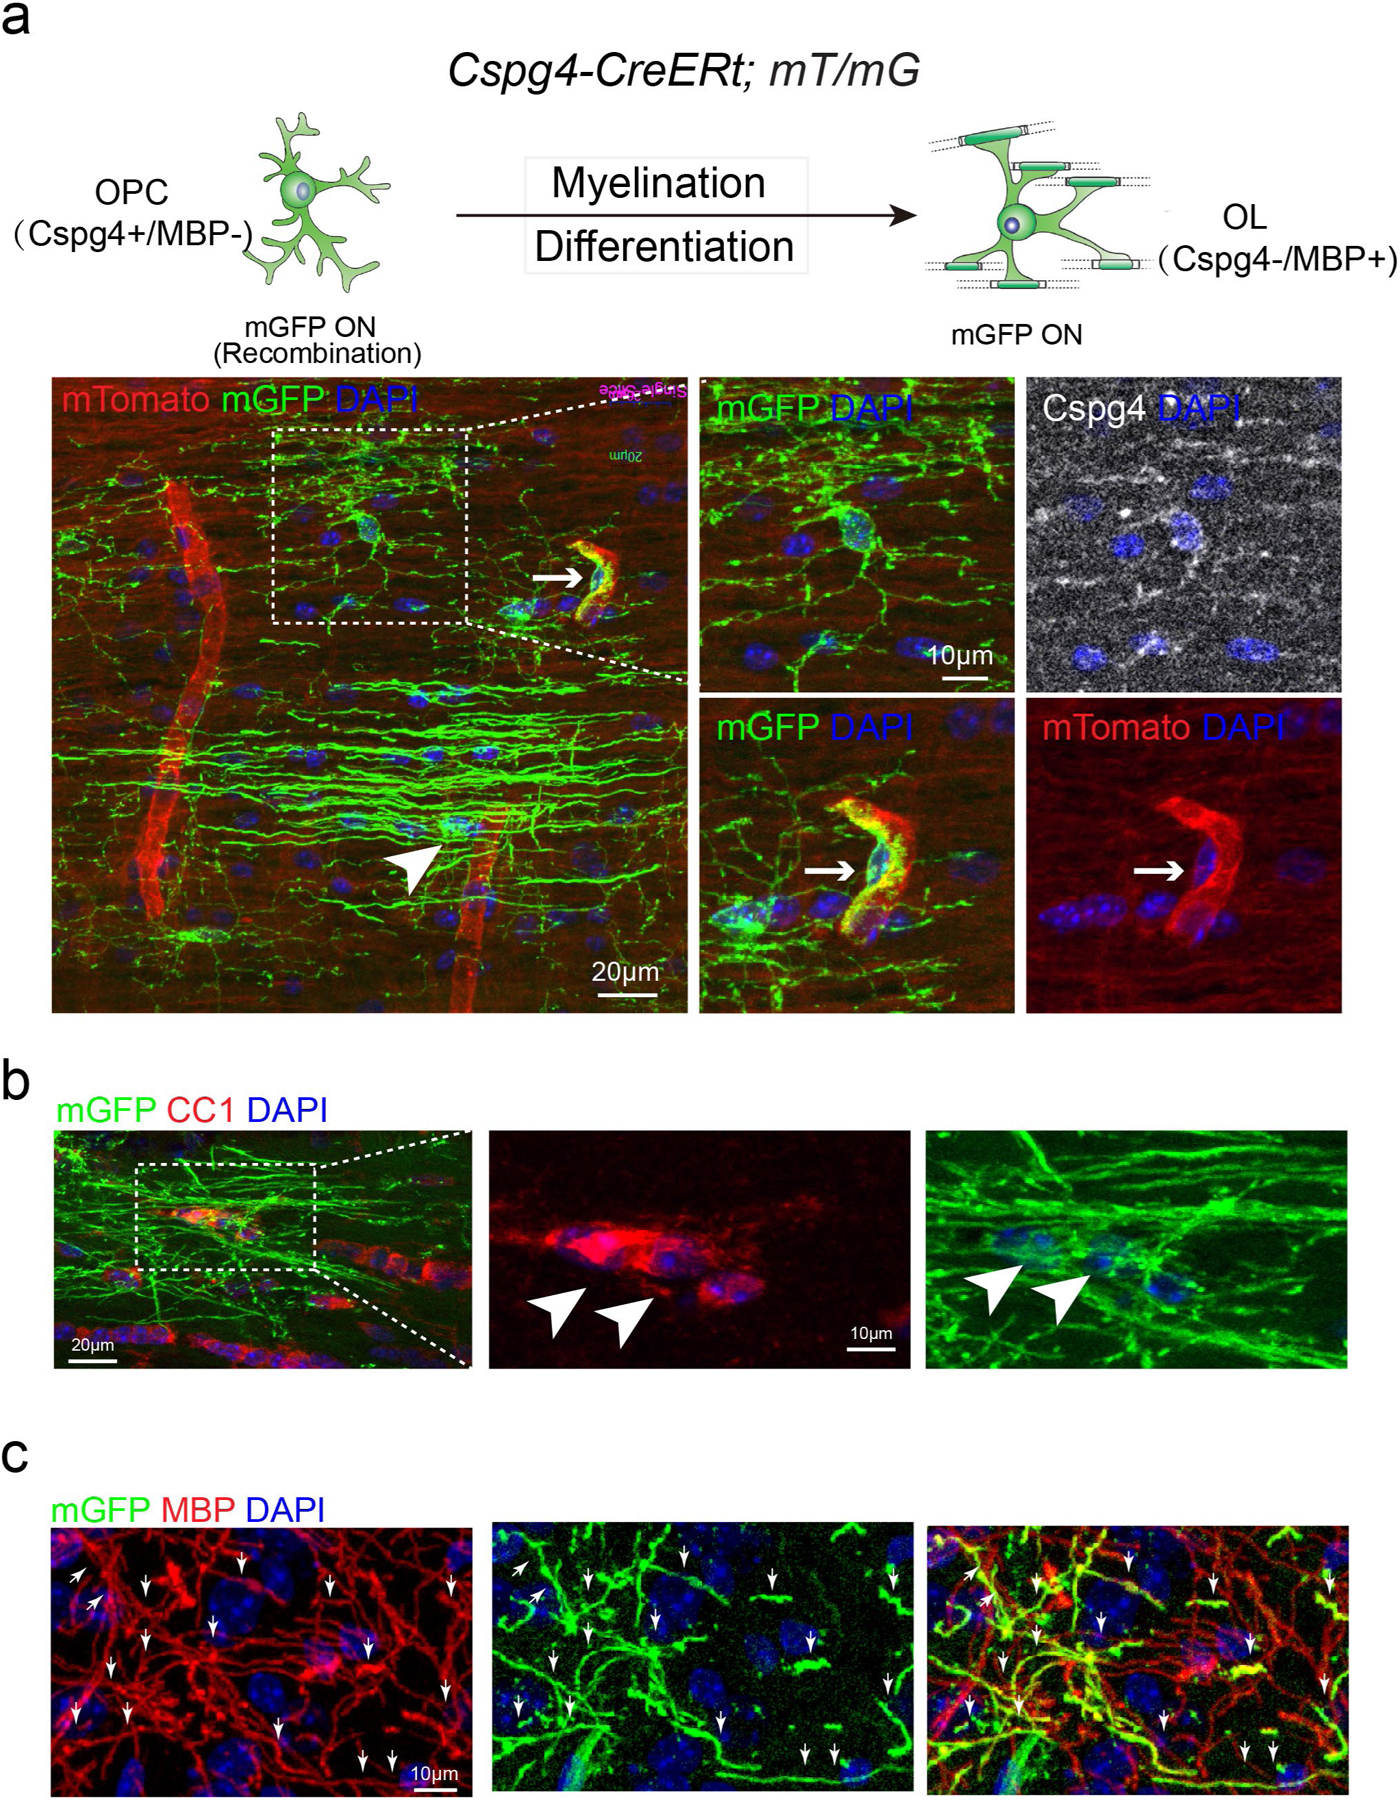
a, Schematic illustration showing the mGFP expression pattern in the Cspg4-CreERt; mT/mG mice and representative image showing mGFP (green)/Cspg4 (gray) double positive OPCs, putative mGFP positive OLs (arrowhead) and mGFP (green)/mTomato (red) double positive pericytes and blood vessels (right lower panels, arrows), Scale bar: 20 μm; b, Immunostaining showing mGFP (green)/CC1 (red) double positive OLs (arrowheads), Scale bar: 20 μm (left panel); 10 μm (middle and right panel); c, mGFP (green)/MBP (red) double positive myelin sheaths (arrows), sale bar = 10 μm. These experiments were repeated 3 times independently with similar results.