
Extended Data Fig. 6 |. Segregating mGFP positive pericytes, oPCs and oLs in the Cspg4-CreERt; mT/mG brains.
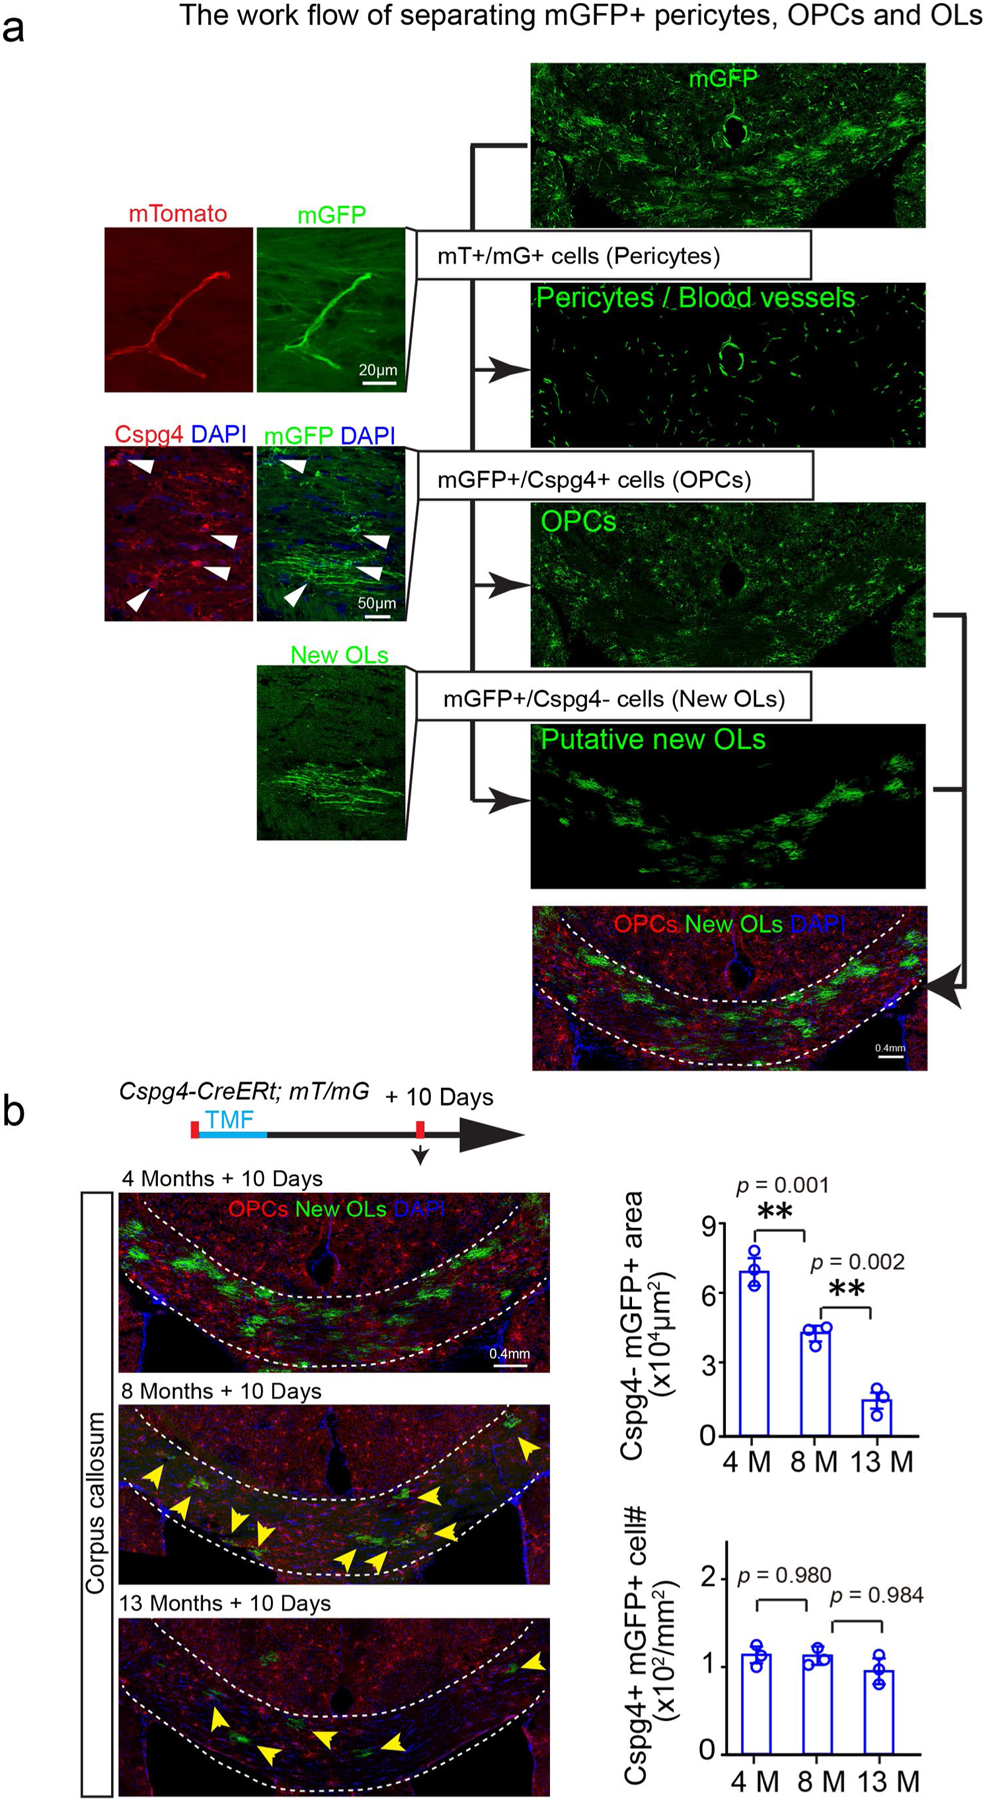
a, The blood vessels (red) /pericytes (green) (mT/mG double positive) are segregated and deducted from the mGFP channel, and the Cspg4 (red)/mGFP (green) double positive OPCs are pseudo-colored in red, Cspg4 immunostaining in Cspg4-CreERt; The experiments were repeated 3 times independently with similar results. Scale bar: 20μm (left panels on the top); 50μm (left panels on the bottom); 0.4 mm (right panels); b, Schematic diagram displaying the time course of tamoxifen induction and histology in the Cspg4-CreERt; mT/mG mice, and representative images of Cspg4 + /mGFP + OPCs (red) and Cspg4-/mGFP + new OLs (green, arrows) in the corpus callosum at 4-, 8- and 13 months, 10 days after induction and quantification of Cspg4 + /mGFP + OPC density and Cspg4-/mGFP + new myelin area, n = 3 biologically independent mice for each group, one-way ANOVA was used followed by post hoc Tukey test (Cspg4-/mGFP+area: F(2,6) = 97.587, p < 0.001, TUKEY (4 M versus 13 M): p = 0.001, TUKEY (8 M versus 13 M): p = 0.010; Cspg4+/mGFP+cell: F(2,6) = 0.066, p = 0.937). Scale bar = 0.4 mm. Points represented individual animals. Error bars represent mean ± s.e.m. **p < 0.01.