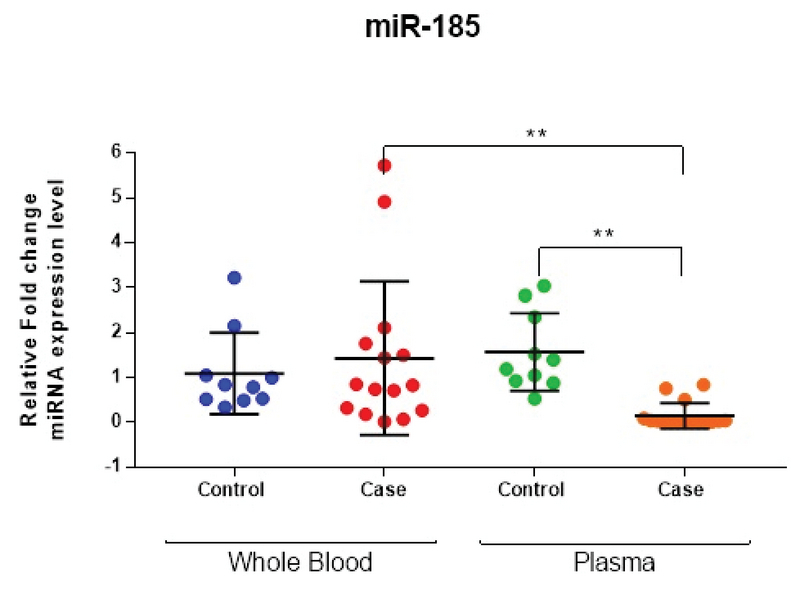
Figure 3.

Quantitative real-time PCR analysis of miR-185-5p in whole blood and plasma in the case group compared to the controls (n = 25, pooled sample). The results are normalized relative to the expression level of the reference gene, SNORD47. Lines are drawn to demonstrate the median value, and the Mann-Whitney U test was used to calculate statistical significance (** p 0.01, nonparametric Mann-Whitney test).
