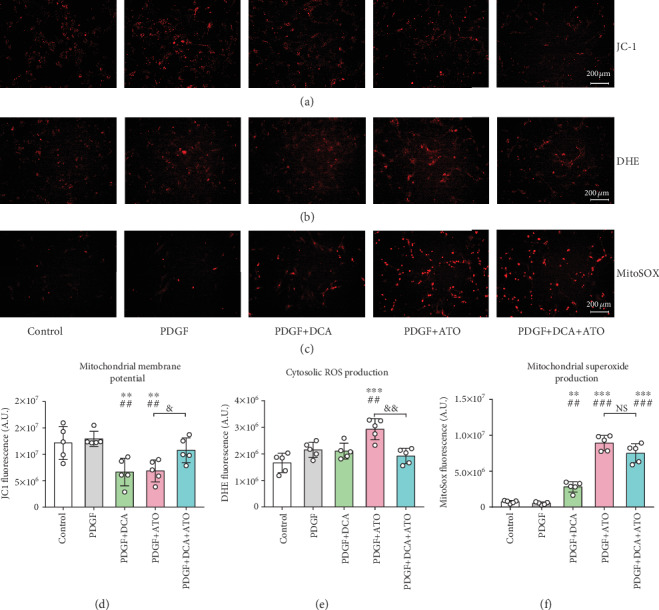
Figure 4.

Dichloroacetate and atorvastatin regulated mitochondrial alterations in PASMCs. (a) Mitochondrial membrane potential (MMP) evaluated using the JC-1 probe. (b) Cytosolic ROS production detected using the DHE fluorescence probe. (c) Mitochondrial superoxide expressed by MitoSOX fluorescence probe. (d–f) Semiquantitation of MMP (d), cytosolic reactive oxygen species (e), and mitochondrial superoxide (f) (n = 5). ∗∗ and ∗∗∗ indicate P < 0.01 and P < 0.001, respectively, comparing the control group; ## and ### indicate P < 0.01 and P < 0.001, respectively, comparing the PDGF group. & and && indicate P < 0.05 and P < 0.01, PDGF+ATO compared with PDGF+DCA+ATO. Scale bars: 200 μm.
