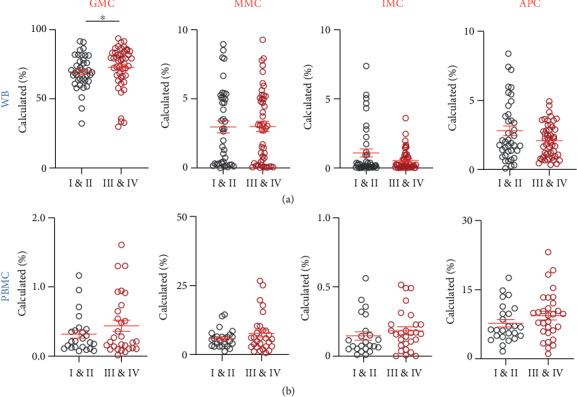
Figure 4.

Comparison of levels of circulating myeloid cells in whole blood and PBMCs with TNM disease stages of CRC patients. CRC patient samples were divided into two groups based on the TNM stage, localized disease (stages I and II; WB, n = 40 and PBMCs, n = 25) and regional lymph node or distant metastases (stages III and IV; WB, n = 48 and PBMCs, n = 30). Cumulative scatter plots show the differences in calculated percentages of GMCs, MMCs, IMCs, and APCs in WB (a) and PBMCs (b) of CRC patients with different TNM disease stages. The P values are represented as follows: ∗P < 0.05. Data depict the mean ± standard error of the mean (SEM).
