
Figure 5.
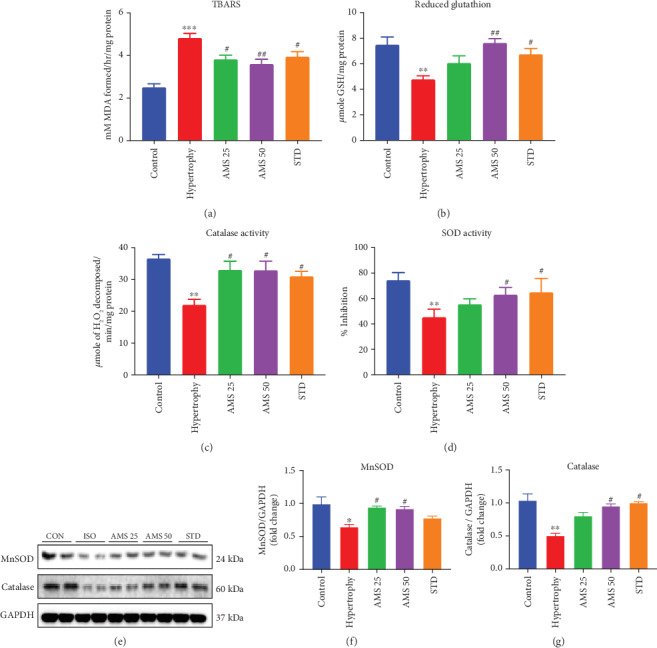
Effect of AMS on biochemical parameters and endogenous antioxidants. (a) Thiobarbituric acid reactive substances (TBARS). (b) Reduced glutathione (GSH). (c) Catalase activity. (d) Super oxide dismutase activity (SOD). (e) Representative western blot images of MnSOD, catalase, and GAPDH. (f) Densitometric analysis of manganese superoxide dismutase (MnSOD). (g) Densitometric analysis of catalase expression. Protein expression data were normalized with the reference protein expression, GAPDH. Data were expressed as mean ± SEM, (n = 5 for biochemical parameters and n = 4 for protein expression). ∗p < 0.05, ∗∗p < 0.01, and ∗∗∗p < 0.001 vs control group and #p < 0.05, ##p < 0.01 vs hypertrophy.