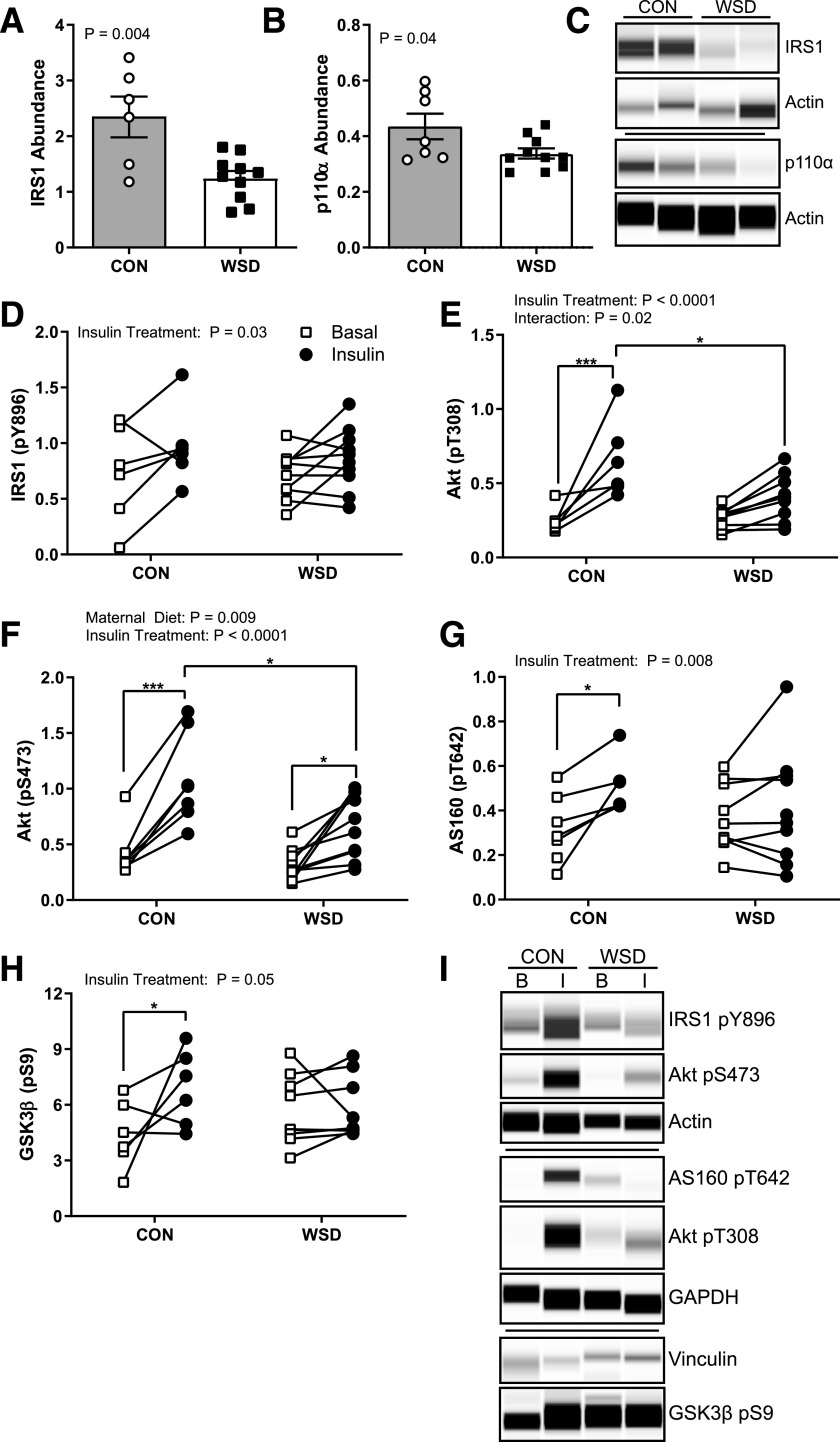
Figure 3.
Fetal skeletal muscle ex vivo insulin response. The abundance of total IRS1 (A) and total p110α (B) measured in homogenate of soleus muscle in the basal state expressed as the peak area relative to the control protein Actin. C: Example of Simple Western probing for IRS1, p110α, and Actin. D–H: Quantification of Simple Western probing of soleus muscle homogenates for insulin-responsive phosphorylation of IRS1 Y896 (D), Akt T308 (E), Akt S473 (F), AS160 T642 (G), and GSK3β S9 (H) expressed as the peak area relative to control proteins Actin, GAPDH, or Vinculin in basal and insulin-stimulated samples ex vivo. I: Example Simple Western probing for insulin-responsive protein phosphorylation. Data are expressed as mean ± SEM, with individual data points shown. Total protein abundance was analyzed by unpaired t test. Phosphorylated (p) Akt abundance was analyzed by two-way ANOVA with Tukey multiple comparisons test. All other phosphorylated protein abundance was analyzed by a mixed-effects model with Sidak correction. Brackets indicate group comparisons (*P ≤ 0.05, **P ≤ 0.01, ***P ≤ 0.001, n = 6–7 in CON and 8–10 in WSD).

