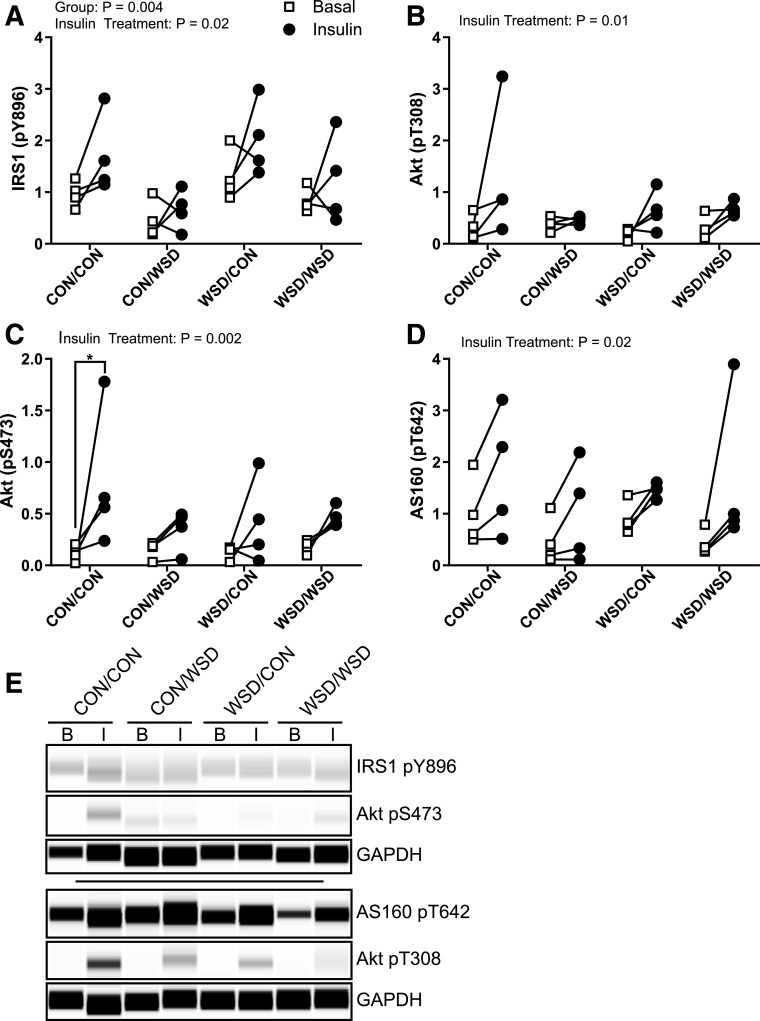
Figure 5.
Juvenile skeletal muscle ex vivo insulin response. Insulin-responsive protein phosphorylation (p) measured by Simple Western in ex vivo basal and insulin-stimulated soleus. IRS1 pY896 (A), Akt pT308 (B), Akt pS473 (C), and AS160 pT642 (D) peak area expressed as a ratio to the control protein GAPDH. E: Example Simple Western of phosphorylated protein staining in basal (B) or insulin-stimulated (I) samples. CON/CON, maternal CON diet, postweaning CON diet group; CON/WSD, maternal control diet, postweaning WSD group; WSD/CON, maternal WSD, postweaning CON diet group; WSD/WSD, maternal WSD, postweaning WSD group. Data were analyzed by two-way ANOVA with Tukey multiple comparisons test. Brackets indicate group comparisons (*P ≤ 0.05, n = 4 in all groups).

