Figure 2.
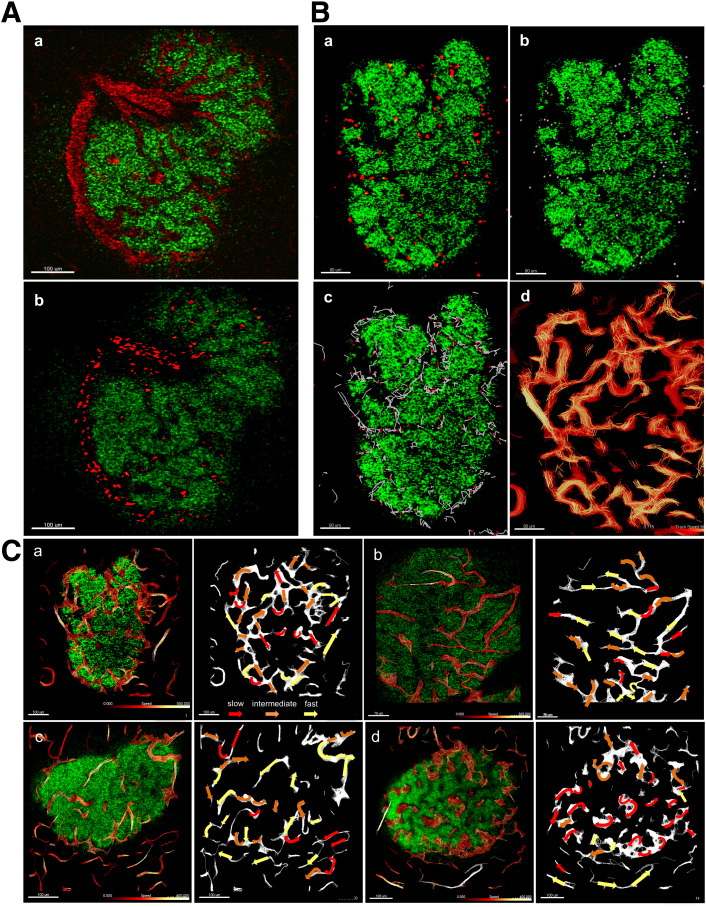
Measurement of RBC flow in mouse islets. A: (a) Fluorescent signal of dextran in mouse islet vasculature. (b) Fluorescent signal of labeled individual RBCs in mouse islet vasculature. Scale bar: 100 μm. B: (a) Fluorescent signal of labeled individual RBCs. (b) Computer-generated spheres representing tracked RBCs. (c) Computer-generated spheres showing path of RBC movement through tailing. (d) Heatmap of RBC speed within the islet (fast to slow, white to red). Scale bar: 80 μm. C: Heatmap of RBC pathways through mouse islets (β-cells in green). (a) (left) Individual pathways are color coded from slow (dark red, 0 μm/s) to fast (white, 500 μm/s). (right) Arrows depict the direction of flow and are color coded according to RBC speed in the indicated region (red, slow; orange, intermediate; yellow, fast). Scale bar: 100 μm. (b) Speed scale 0–500 μm/s. Scale bar: 70 μm. (c) Speed scale 0–400 μm/s. Scale bar: 100 μm. (d) Speed scale 0–400 μm/s. Scale bar: 100 μm. See also Supplementary Videos 1–7.

