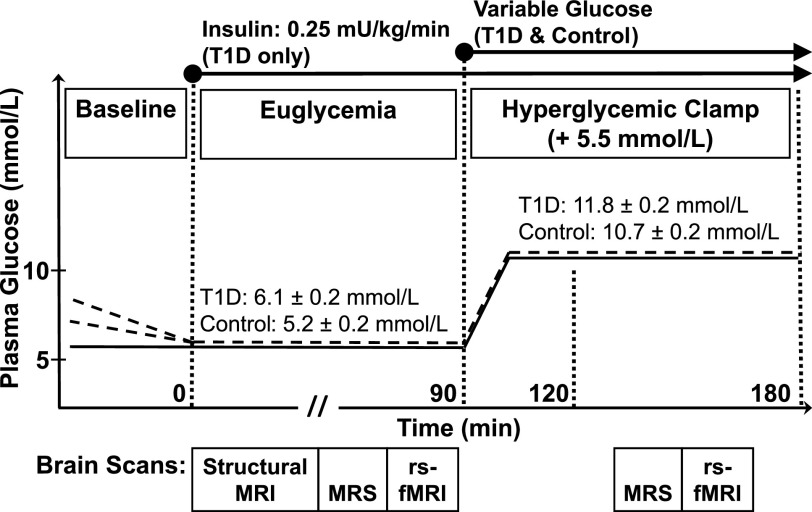
Figure 1.
Experimental protocol. Plasma glucose levels vs. experiment time. Dotted lines represent subjects with T1D, and solid lines represent control subjects. During baseline, subjects with T1D received a low-dose insulin infusion to reduce their plasma glucose to euglycemia. An EU period was followed by an HG period. At the beginning of EU (time = 0) and during the entire experiment, subjects with T1D received a constant basal insulin infusion at 0.25 mU/kg/min. After EU scans, all subjects exited the scanner to initiate the HG period with a primed variable glucose infusion to attain a target increase in glycemic level of 5.5 mmol/L. Subjects were repositioned in the scanner when plasma glucose levels had stabilized at the EU +5.5 mmol/L level for the HG scanning period. Scans were performed during each of the two plasma glucose conditions, indicated by boxes beneath each plot. The mean ± SE values of plasma glucose are indicated for each visit and condition for the T1D and control groups.

