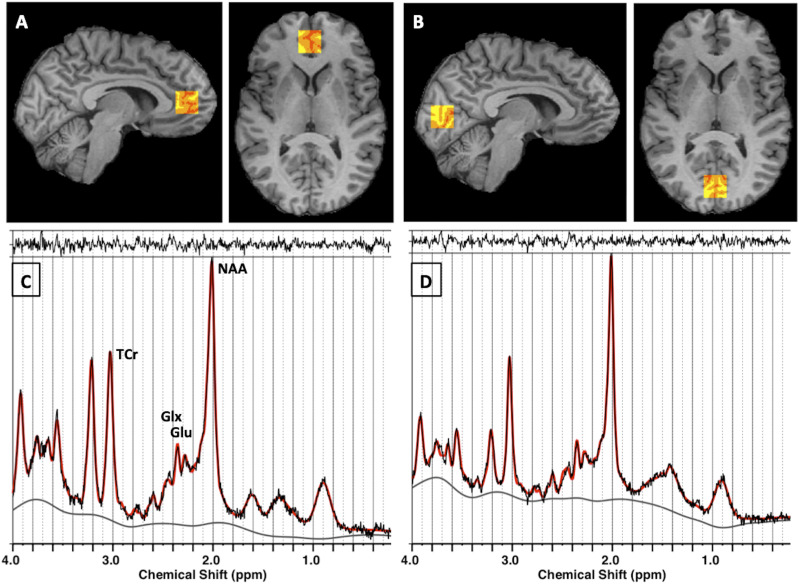
Figure 2.
MRS: localization of voxels and spectra analyzed using LCModel. A and B: Red-yellow scale boxes overlaid on a subject’s T1-weighted image in gray scale on sagittal (left) and axial (right) slices show the voxel regions where MRS data were acquired. The colors show the result of the brain tissue segmentation inside the voxel as follows: red, cerebrospinal fluid; orange, gray matter; and yellow, white matter. A: Pregenual ACC. B: OCC. C and D: In vivo point-resolved spectroscopy data are shown in black; the LCModel fit to data is shown in red. The top margin shows the residual to the fit, and the bottom line is the spectral baseline fit. C: Pregenual ACC. D: OCC. Glu, glutamate.

