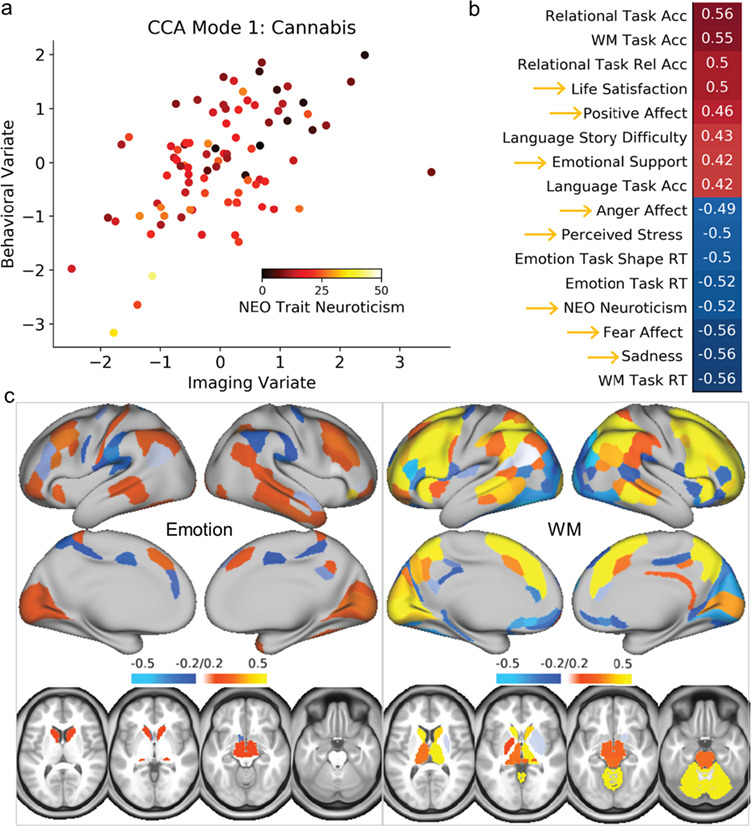
Figure 3.

CCA results for the cannabis-dependent group. (a) Scatter plot of CCA mode 1, showing the correlation of the individual subject weights between the imaging and behavioral variates, color-coded by trait neuroticism, as an example measure. (b) Behavioral loadings for the CCA mode. Gold arrows indicate the measures of emotion. (c) Imaging loadings for the CCA mode. Note the mixture of cognitive task performance and self-reported emotionality among the top weights, as well as the overlapping weights for brain activation in both the emotion and WM cognitive fMRI task.
