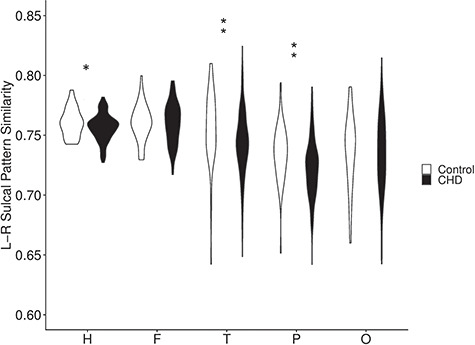
Figure 2.

Violin plots showing the distribution of the left–right sulcal pattern symmetry within the control group (n = 45) and within the CHD group (n = 115) (*P < 0.05, **FDR q < 0.05, F: frontal, H: hemisphere, L: left, L-R: left versus right, O: occipital, P: parietal, R: right, T: temporal).
