Figure 2.

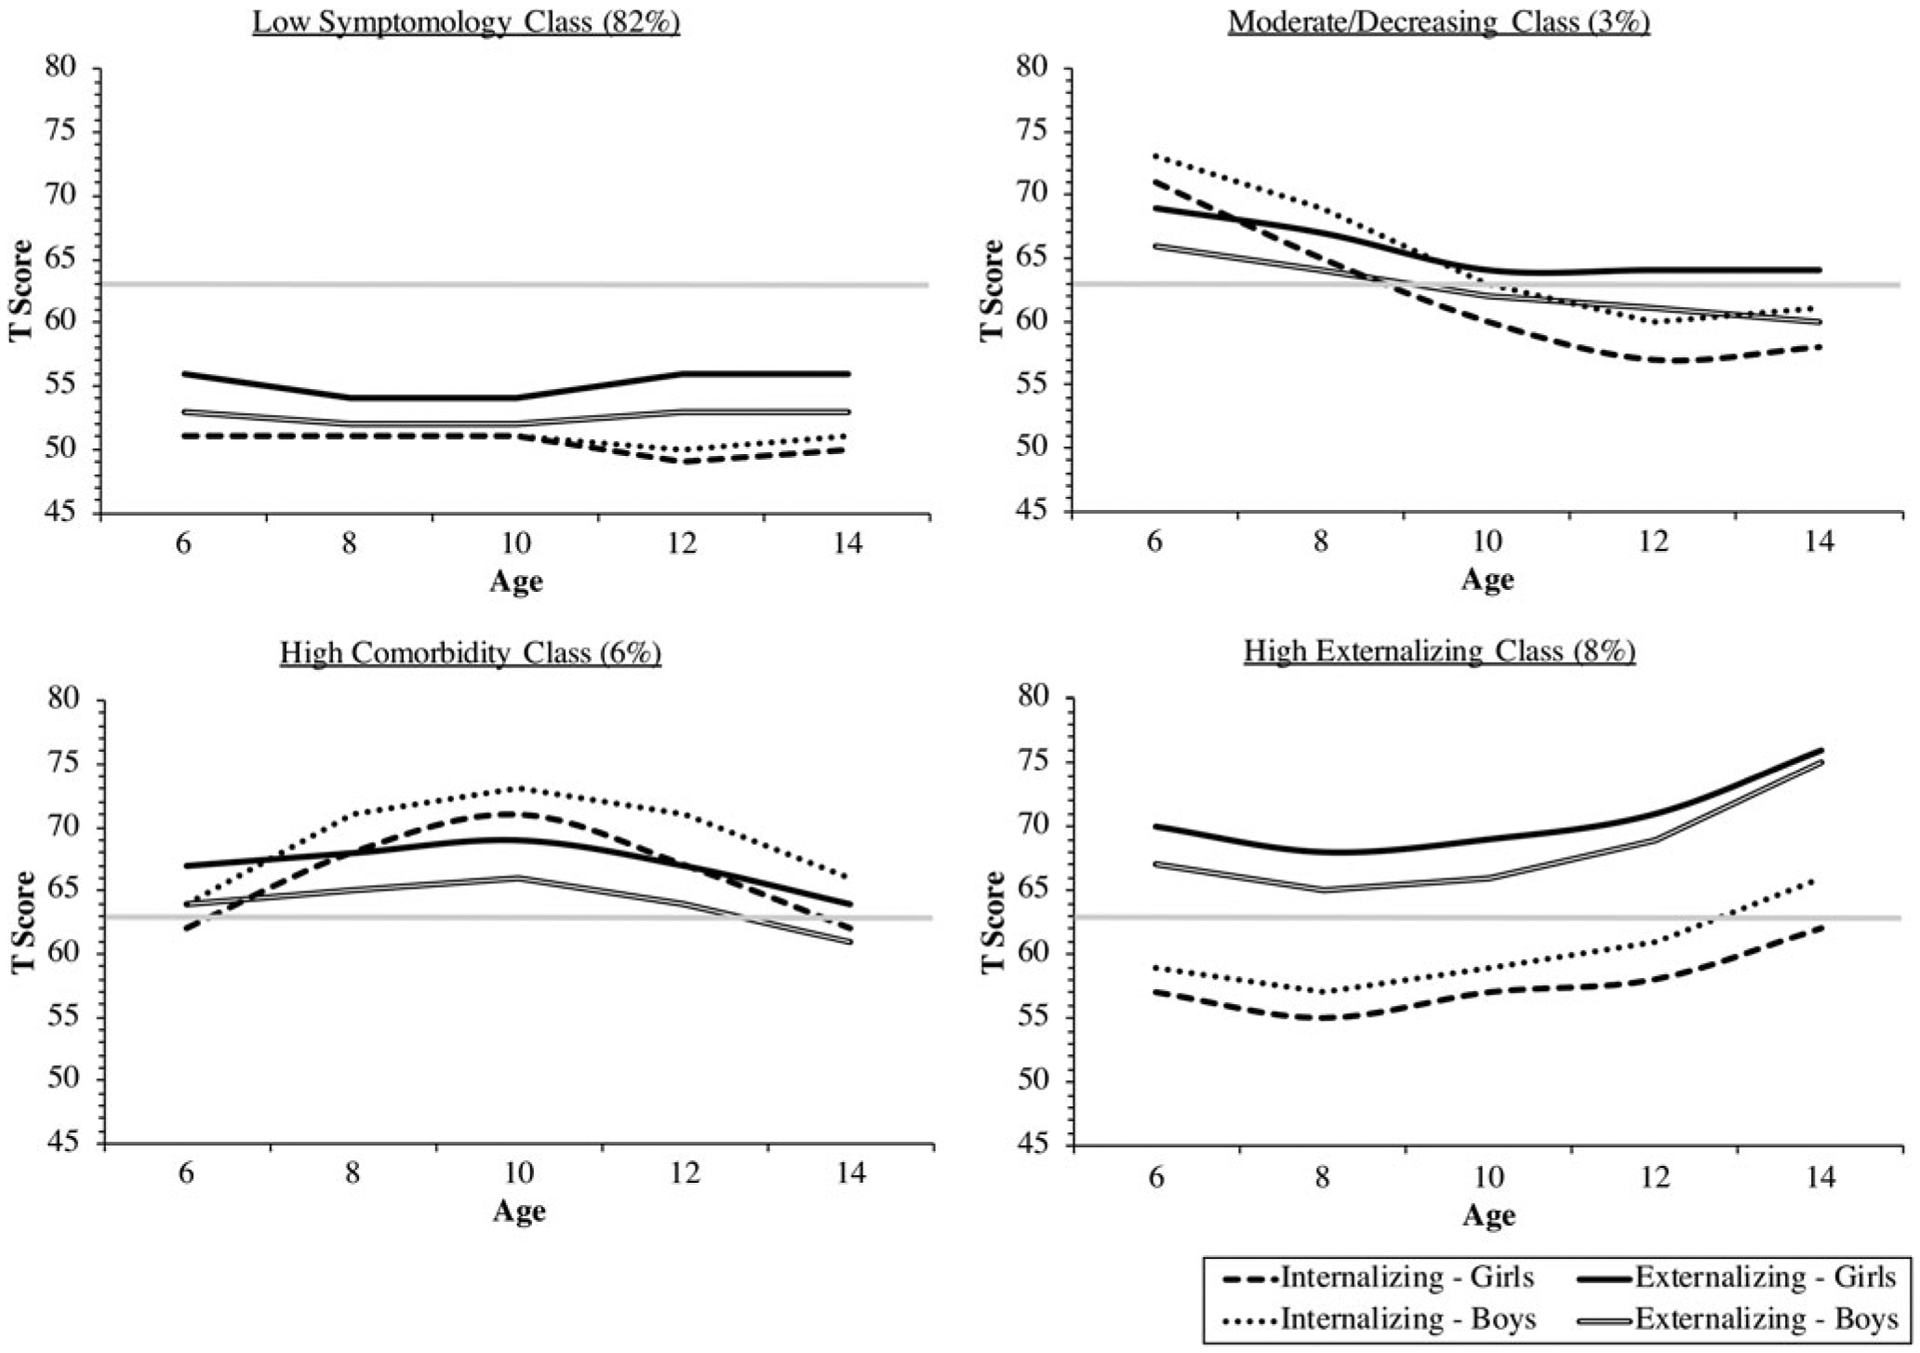
Four-class bivariate growth curve solution. On each graph, the gray line represents the clinical cut off score. T scores greater than 63 are considered to be clinically significant.

Four-class bivariate growth curve solution. On each graph, the gray line represents the clinical cut off score. T scores greater than 63 are considered to be clinically significant.