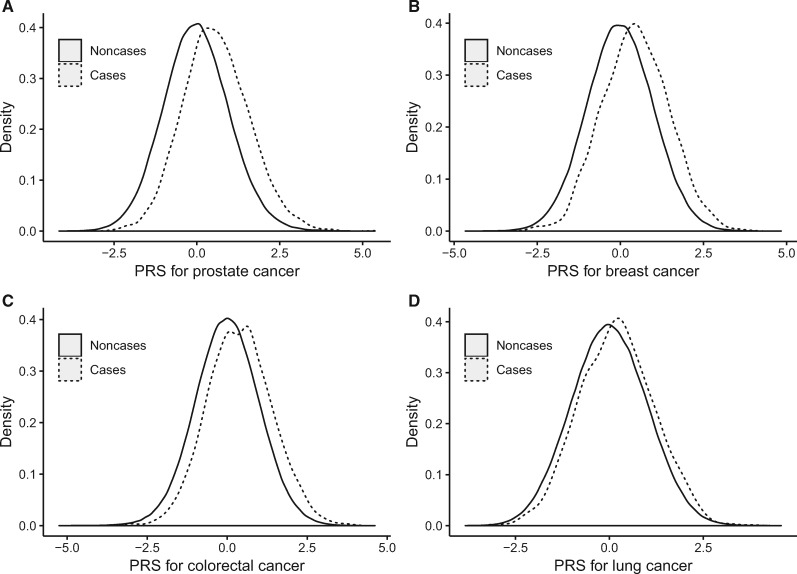
Figure 1.
Distribution of standardized PRS between case patients and noncase patients. Distribution of standardized PRS was displayed for cancer of the (A) prostate, (B) breast, (C) colorectal, (D) and lung. Case patients (solid line) have a higher PRS value compared with noncase patients (dashed line) for all four cancers. PRS was standardized by subtracting the mean and dividing by the standard deviation. PRS = polygenic risk score.

