
Fig. 2|. Altered CA1 place cell activity during SPW-R episodes.
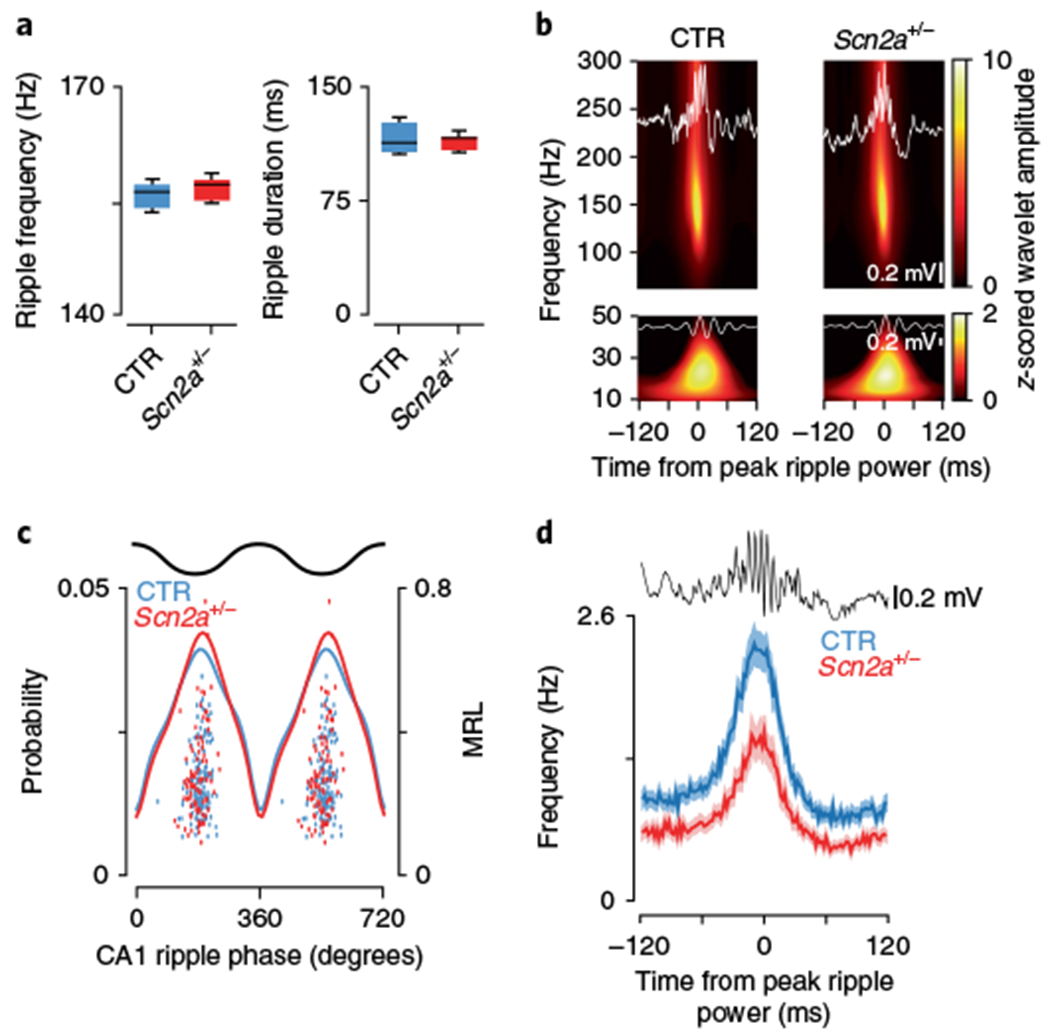
a, SPW-Rs had a similar frequency (left, P = 0.23, t(12) = 1.26, Student’s two-sided t-test; CTR: N = 7 animals; SCN: N = 7 animals) and duration (right, P = 0.39, t(12) = 0.89, Student’s two-sided t-test; CTR: N = 7 animals; SCN: N = 7 animals) in both experimental groups. b, Spectral analysis during SPW-R periods revealed that z-scored wavelet amplitudes were not significantly different in either the ripple band (top, 140–160 Hz, P = 0.21, Z = 1.24, Wilcoxon rank-sum; CTR: N = 7 animals, n = 2,372 ripples; SCN: N = 7 animals, n = 1,811 ripples) or the low gamma band (bottom, 20–40 Hz, P = 0.17, Z = 1.36, Wilcoxon rank-sum; CTR: N = 7 animals, n = 2,372 ripples; SCN: N = 7 animals, n = 1,811 ripples). c, Ripple phase preference was similar between groups in both strength (P = 0.57, F = 0.33, ANOVA; CTR: N = 7 animals, n = 190 cells; SCN: N = 7 animals, n = 131 cells) and the preferred phase angle (P = 0.17, F = 1.86, circular ANOVA; CTR: N = 7 animals, n = 190 cells; SCN: N = 7 animals, n = 131 cells). Mean phase probabilities are shown for all significantly modulated cells (solid lines), with overlaid scatter plots showing the preferred phase and mean resultant length for all significantly modulated neurons. d, Place cells in control mice (blue) had significantly elevated peak firing rates during SPW-Rs compared with the Scn2a+/− (red) group (P = 1.30 × 10⁻⁴, Z = 4.36, two-sided Wilcoxon rank-sum; CTR: N = 7 animals, n = 190 cells; SCN: N = 7 animals, n = 131 cells); shaded area signifies s.e.m. All box plots represent median (black line) and 25th–75th percentiles, with whiskers extending to the extreme data points excluding outliers, which are plotted as individual crosses. *P < 0.05.