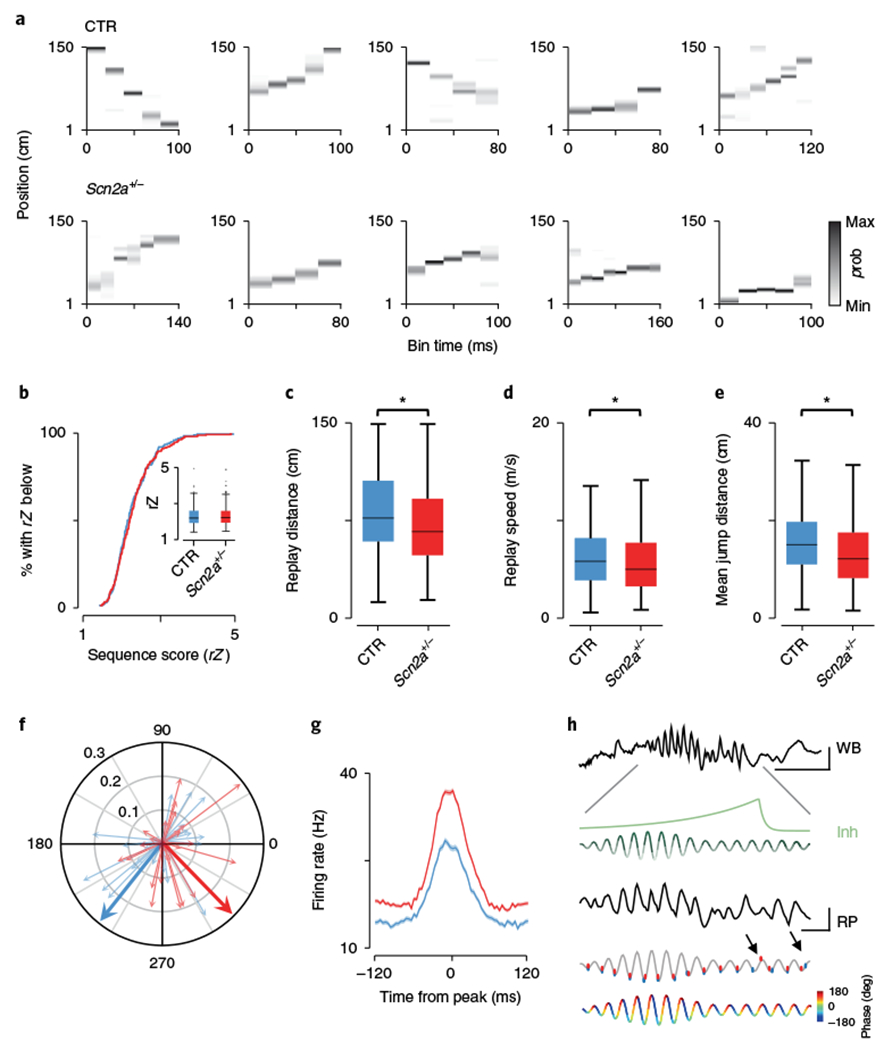
Fig. 4|. Replayed trajectory sequences are truncated in Scn2a+/− mice.

a, Examples of trajectory sequences derived from Bayesian decoding of spiking activity during SPW-Rs. Top, controls; bottom, Scn2a+/− mice; p, probability. b, Cumulative distribution of replay event sequence scores (rZ) for control (blue) and Scn2a+/− (red), with medians and data distribution displayed in the inset (P = 0.58, Z = 0.55, two-sided Wilcoxon rank-sum; CTR: N = 7 animals, n = 203 events; SCN: N = 7 animals, n = 271 events). c, Mean distance of the linear track spanned by all replay events (P = 7.03 × 10⁻⁴, Z = 3.39, two-sided Wilcoxon rank-sum; CTR: N = 7 animals, n = 203 events; SCN: N = 7 animals, n = 271 events). d, Average speed in m/s of progression from starting position to end position for all replay events (P = 0.012, Z = 2.53, two-sided Wilcoxon rank-sum; CTR: N = 7 animals, n = 203 events; SCN: N = 7 animals, n = 271 events). e, The average spatial jump in centimeters for decoded positions in adjacent temporal bins, for each replay event (P = 4.94 × 10⁻⁴, Z = 3.48, two-sided Wilcoxon rank-sum; CTR: N = 7 animals, n = 203 events; SCN: N = 7 animals, n = 271 events). f, Polar plot showing the mean phase angle at which all PV fast-spiking interneurons discharge during SPW-Rs (130–180 Hz). Individual neurons are shown as thin pastel arrows, with length indicating the mean resultant length and 0° and 180° representing the peak and trough of the ripple oscillation. Genotype means are displayed as thick arrows and indicate only phase (MRL: P = 0.13, Z = 1.50, Wilcoxon rank-sum; CTR: N = 7 animals, n = 23 putative PV cells; SCN: N = 7 animals, n = 34 putative PV cells; angle: P = 0.047, F = 4.14, circular ANOVA; CTR: N = 7 animals, n = 23 putative PV cells; SCN: N = 7 animals, n = 34 putative PV cells). g, Mean firing rate of all PV interneurons across a 240-ms window centered on the peak power of each ripple event; shaded areas, s.e.m. (P = 0.036, Z = 2.10, two-sided Wilcoxon rank-sum; CTR: N = 7 animals, n = 23 putative PV cells; SCN: N = 7 animals, n = 34 putative PV cells). h, WB: an unfiltered example of a SPW-R event recorded from CA1 stratum pyramidale. In green is a schematic showing the predicted build-up of inhibition (Inh) across the expanded ripple event (RP), based on ref. 41, together with cycle-by-cycle fluctuations in inhibition (with darker colors representing greatest inhibition). In gray is the same ripple bandpass filtered (130–180 Hz); overlaid on this are mean data for all place cells showing mean spike phase of all ripple spikes per cycle relative to the first spike (controls, blue; Scn2a+/−, red). Arrows denote significant changes from mean ripple discharge phase (first arrow: cycle phase CTR vs. Scn2a+/−, P = 0.0099, F = 6.82, circular ANOVA; CTR: N = 7 animals; SCN: N = 7 animals; second arrow: preceding 14th (CTR) vs. current 15th cycle (CTR) phase, P = 0.041, F = 4.24, circular ANOVA; N = 7 animals). Ripple phase is shown at the bottom for clarity; scale bars represents 10 ms and 300 μV throughout. All box plots represent median (black line) and 25th–75th percentiles, with whiskers extending to the extreme data points excluding outliers, which are plotted as individual crosses. *P < 0.05.
