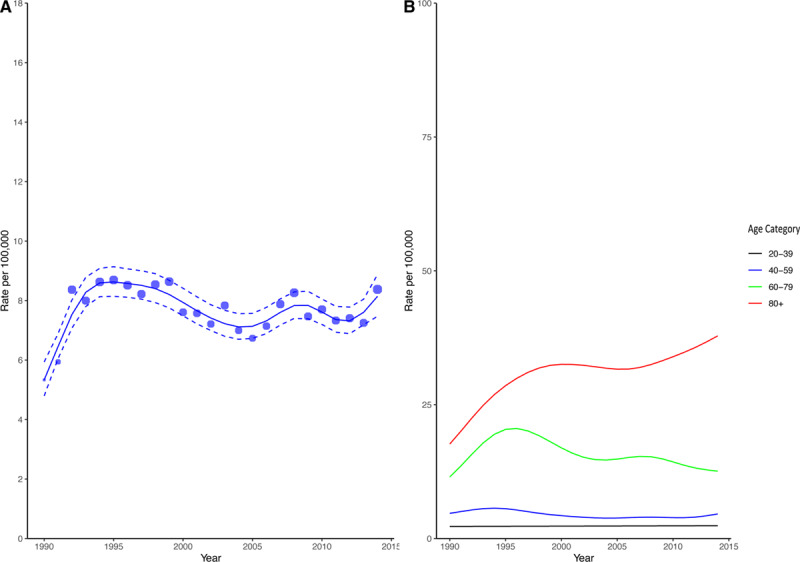
Figure 1.

Estimated incidence rate per 100 000 in the population (A) and stratified by age groups (B). Blue circles in A represent the absolute crude rates with the size of the circles proportional to the absolute count. The solid blue line represents the estimated incident rate from generalized additive modeling using the Poisson distribution. The dashed blue lines represent the corresponding upper and lower 95% CI bounds.
