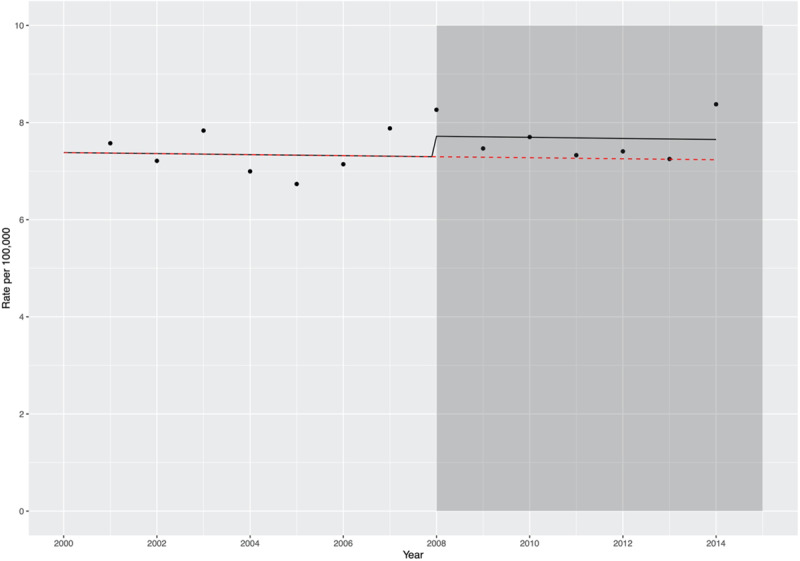
Figure 2.

Plot showing the observed incident rates per 100 000 by year of hospitalization (black dots), in relation to the introduction of national antibiotic prophylaxis guidelines. The shaded gray box indicates introduction of National Institute of Health and Care Excellence antibiotic prophylaxis guidelines. The black line shows the predicted incident rate using the model described in Text VI in the Data Supplement, incorporating the change in guidelines from 2008 onward. The overlying red line shows the predicted incident rate assuming the counterfactual of no change in antibiotic prophylaxis guidelines in 2008.
