
Figure 5.
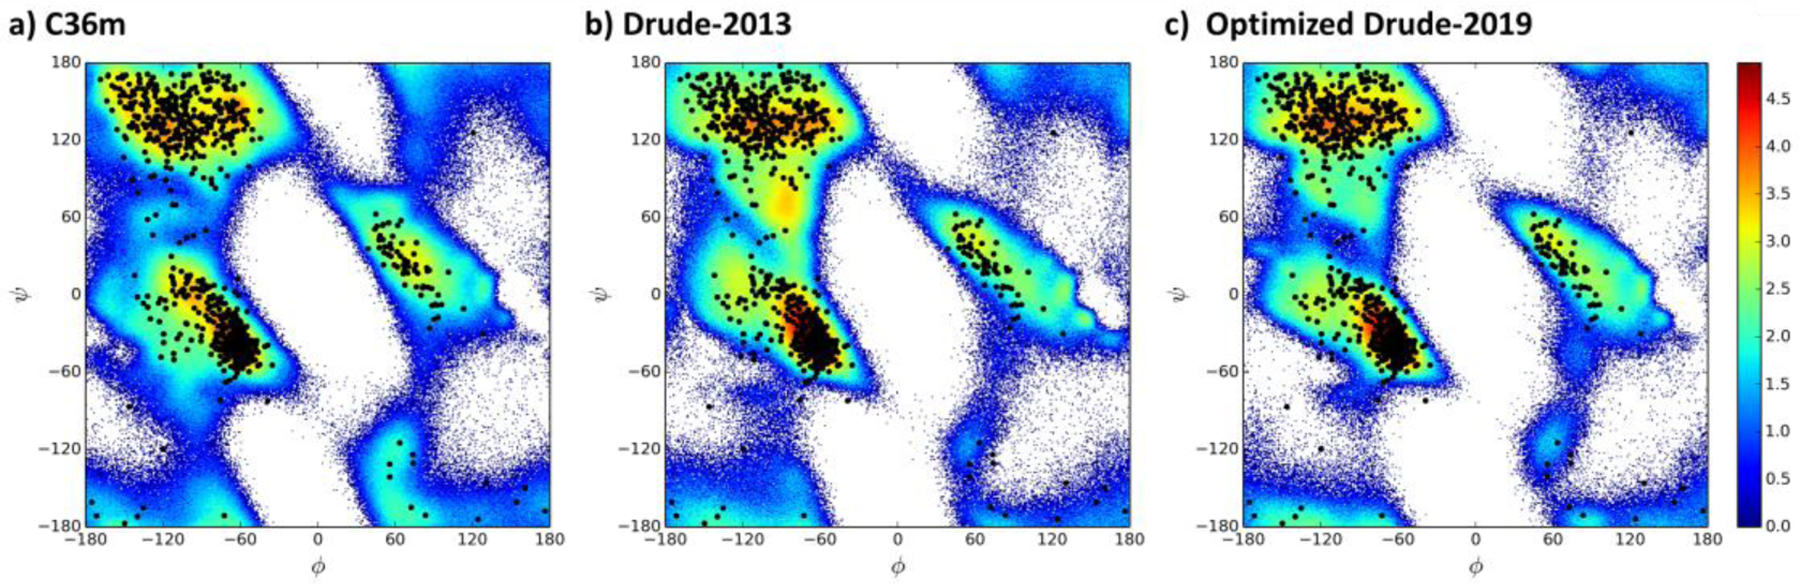
Overall ϕ, ψ distributions for the a) C36m, b) Drude-2013 and c) optimized Drude-2019 models. Results are included from PDB: 1QX5, 4IEJ, 1MJC, 1UBQ, 2QMT, 1IFC, 6LYT, 135L, 1P7E, and 2IGD. Simulation results are presented as inverted Boltzmann distributions which are free energies (FE, kcal/mol) obtained from Boltzmann weighting, FE = kTln(P), of the population, P, in 1˚x 1˚ bins summed over all the proteins where k and T are the Boltzmann constant and temperature, 298˚, respectively. Experimental data from the crystal structures are presented as black dots.