
Figure 2.
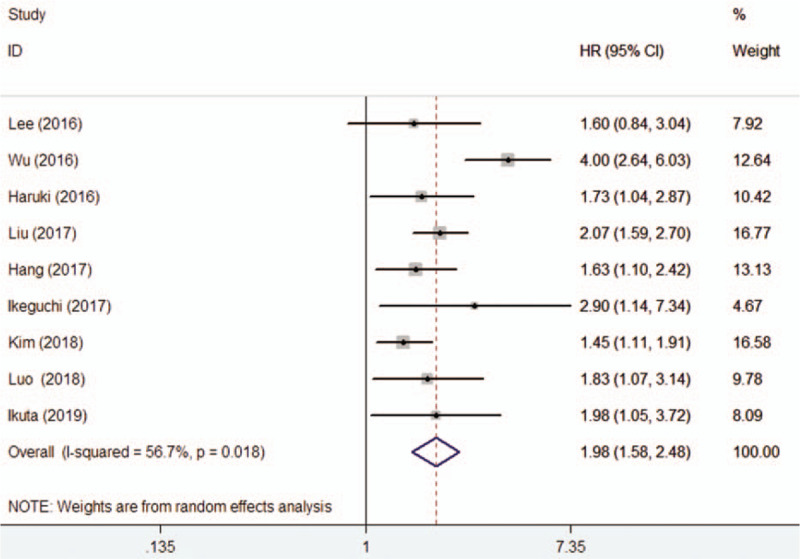
Forest plots showing HR and 95% CI of overall survival for high versus low C-reactive protein to albumin ratio in a random effect model. CI = confidence intervals, HR = hazard ratio.
Official websites use .gov
A
.gov website belongs to an official
government organization in the United States.
Secure .gov websites use HTTPS
A lock (
) or https:// means you've safely
connected to the .gov website. Share sensitive
information only on official, secure websites.
Forest plots showing HR and 95% CI of overall survival for high versus low C-reactive protein to albumin ratio in a random effect model. CI = confidence intervals, HR = hazard ratio.