Figure 3.

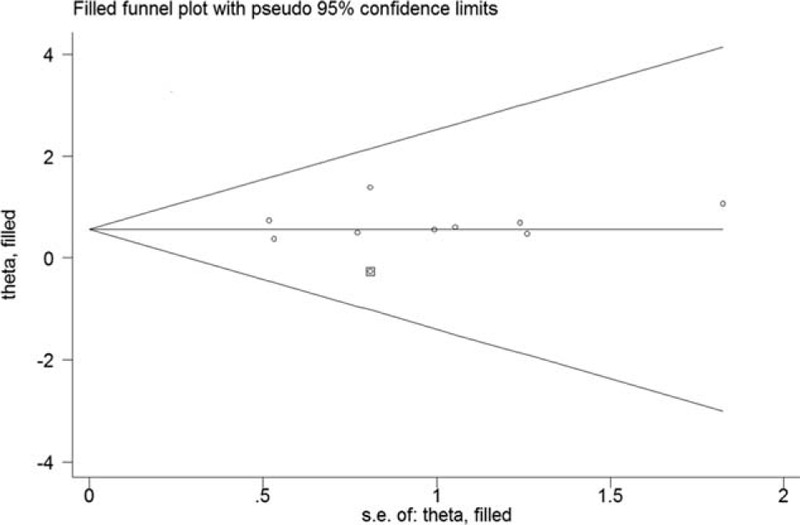
Funnel plot of high C-reactive protein to albumin ratio with overall survival. The circles alone are real studies and the circle enclosed in box is “filled” study.

Funnel plot of high C-reactive protein to albumin ratio with overall survival. The circles alone are real studies and the circle enclosed in box is “filled” study.