
Figure 2.
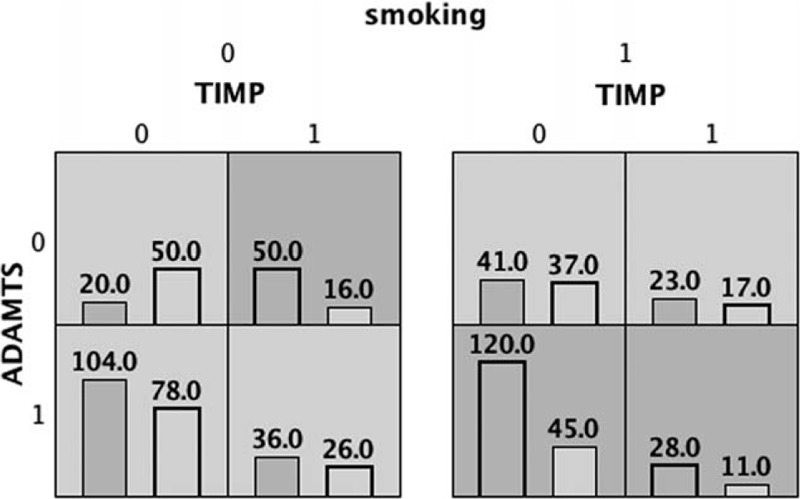
The left column in each cell represents the number of EH cases, and the right column represents the number of NT cases. EH = essential hypertension, NT = normotensive.
Official websites use .gov
A
.gov website belongs to an official
government organization in the United States.
Secure .gov websites use HTTPS
A lock (
) or https:// means you've safely
connected to the .gov website. Share sensitive
information only on official, secure websites.
The left column in each cell represents the number of EH cases, and the right column represents the number of NT cases. EH = essential hypertension, NT = normotensive.