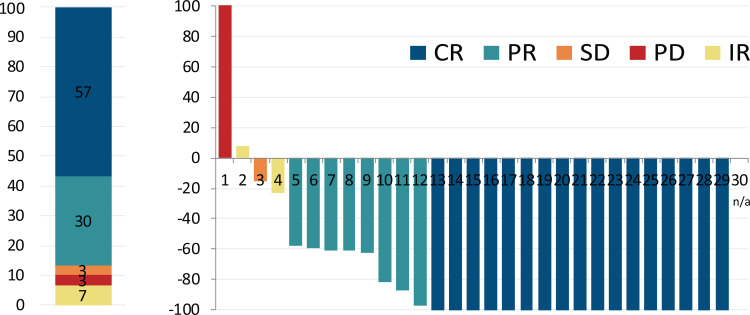
Figure 1.
Best overall response and change of tumor load during therapy. (Left) Structure of best overall response (BOR) during combined treatment. The colors represent the BOR during nivolumab treatment. Numbers represent the percent of patients with particular response type. (Right) Best change from baseline in tumor load for all evaluable cases. Negative values indicate maximum tumor reduction, and positive values indicate tumor increase. N/a: unmeasurable lesions at restaging.

