Figure 5.

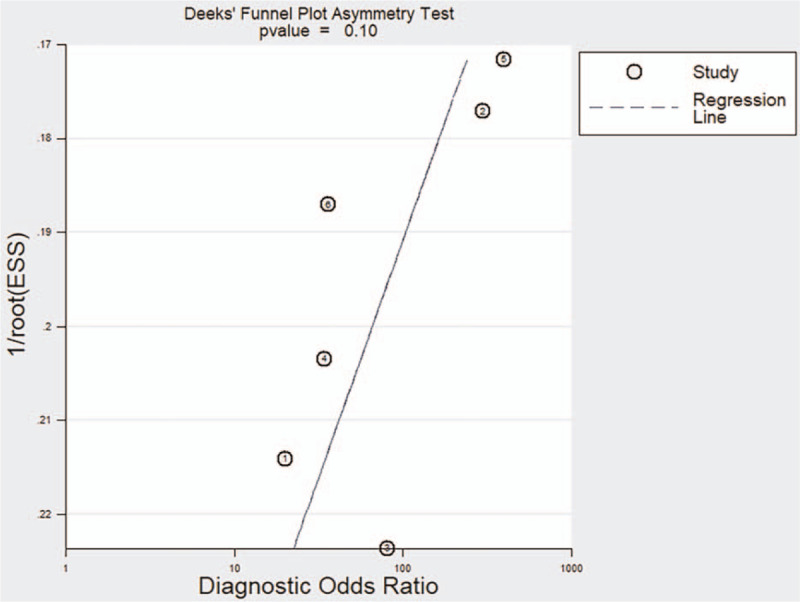
Deek's funnel plot of the relationship of the diagnostic odds ratio with effective sample size for the 6 included studies.

Deek's funnel plot of the relationship of the diagnostic odds ratio with effective sample size for the 6 included studies.