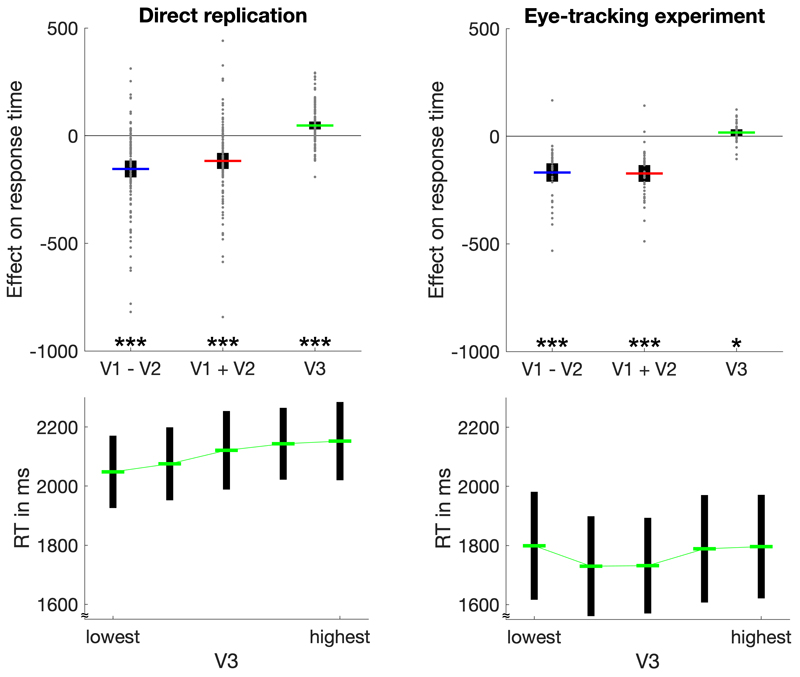
Figure 3. Analyses of distractor effects on RT.
The upper panels depict regression coefficients for the influence of target-value difference, target-value sum, and distractor value on RT in both experiments. Individual data points (gray dots) are shown together with group means (colored lines) and 95% CIs (black error bars). The lower panels show average RT (with 95% CIs) for five levels of V3 from lowest to highest. The increase of RT with increasing V3 is clearly visible in the direct replication. In the eye-tracking experiment, the effect is less pronounced (consistent with the comparatively small effect size in this experiment). *p < .05, ***p < .001

