
Figure 3.
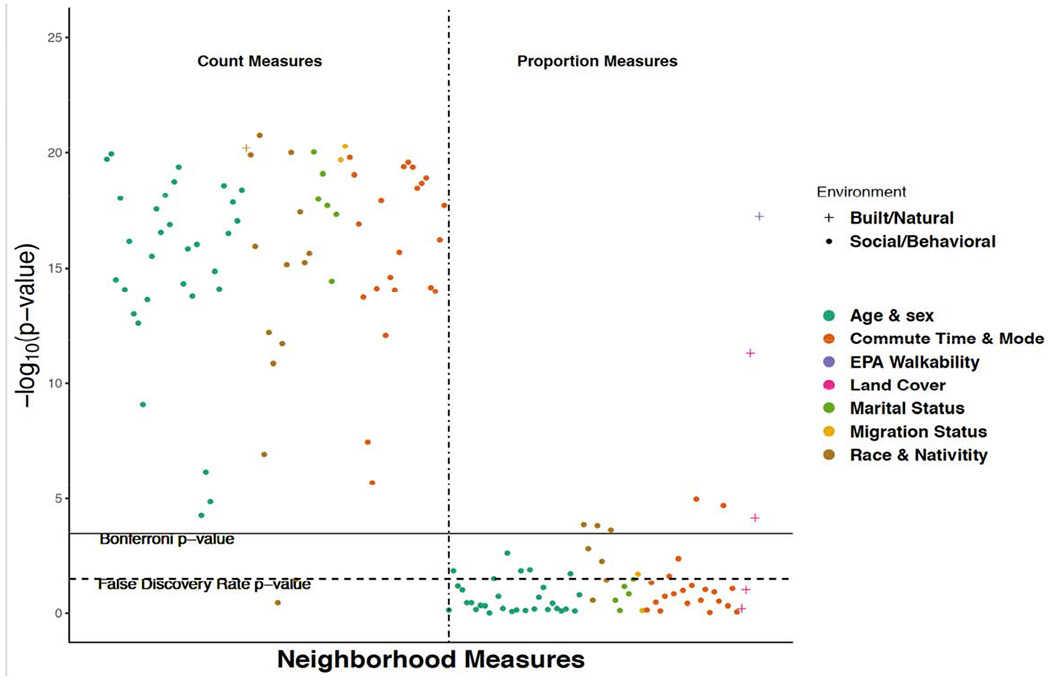
Manhattan Plot showing strength of association (represented as negative log p-value for coefficient from a covariate-adjusted negative binomial model) between the neighborhood measures and number of walk bouts within 833m of home among TRAC study participants, 2009-2013