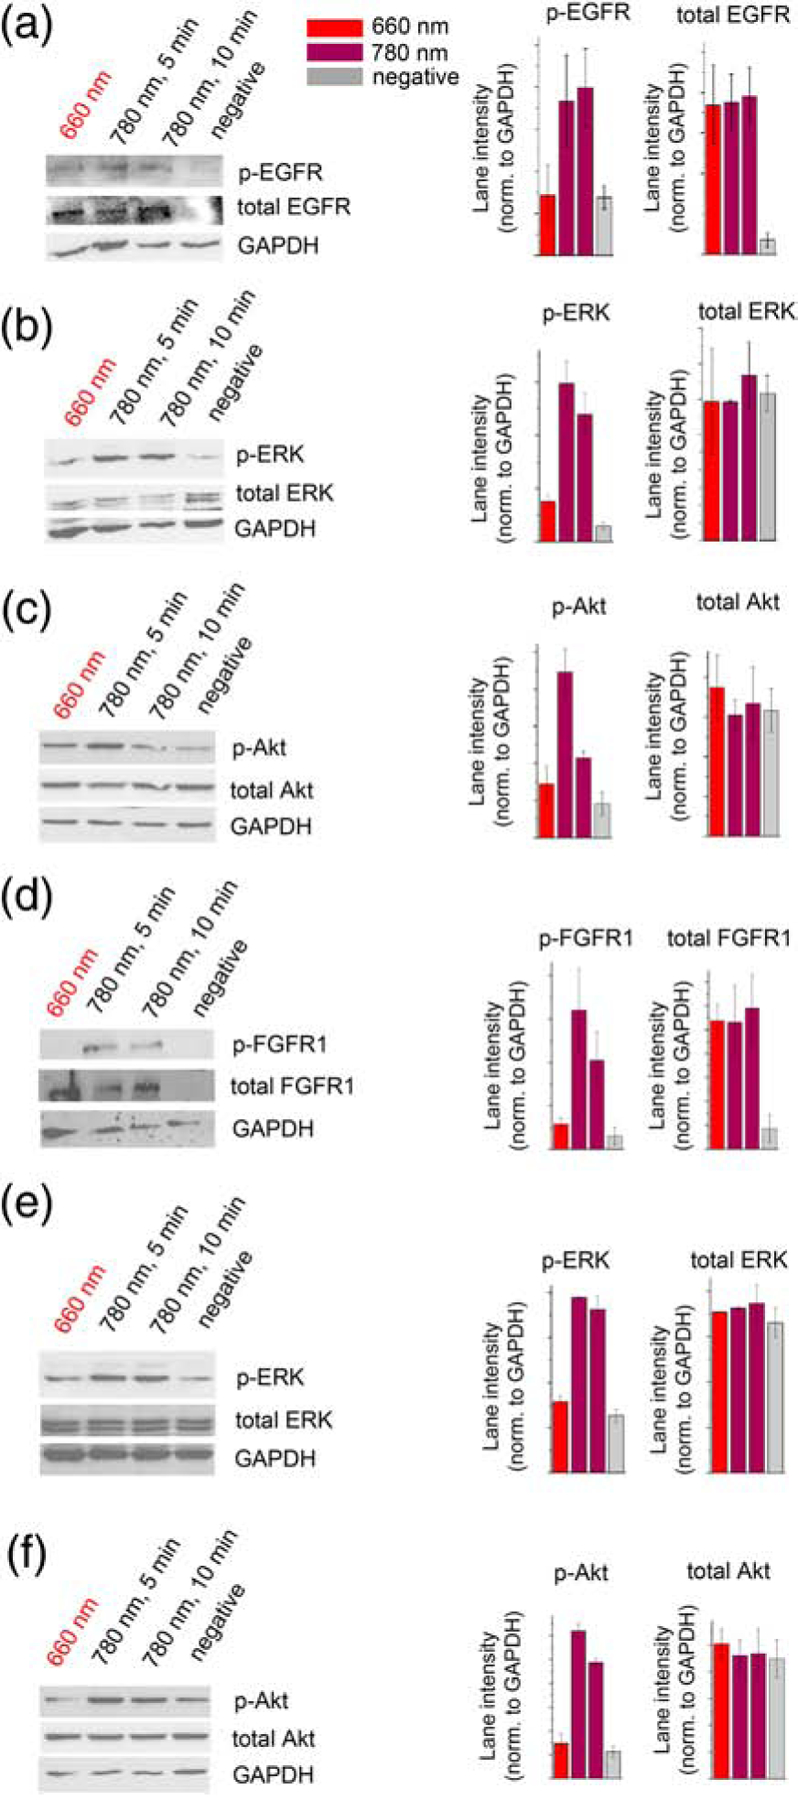
Figure 2. Phosphorylation of Dr-EGFR, Dr-FGFR1 and downstream Akt and ERK kinases.

(a) Western blots of phospho-EGFR, total EGFR and GAPDH in lysates of Dr-EGFR-transfected HeLa cells, and quantification of the lane intensities normalized to GAPDH. (b) Western blots of phospho-ERK, total ERK and GAPDH in lysates of Dr-EGFR-transfected HeLa cells, and quantification of lane intensities normalized to GAPDH. (c) Western blots of phospho-Akt, total Akt and GAPDH in lysates of Dr-EGFR-transfected PC-3 cells, and quantification of lane intensities normalized to GAPDH. In (a)-(c) cells transfected with Dr-EGFR were either kept under 660 nm light, activated for 1, 5 or 10 min with 780 nm light, or did not contain Dr-EGFR (negative control). (d) Western blots of phospho-FGFR1, total FGFR and GAPDH in lysates of Dr-FGFR1-transfected HeLa cells, and quantification of lane intensities normalized to GADPH. (e) Western blots of phospho-ERK, total ERK and GAPDH in lysates of Dr-FGFR1-transfected HeLa cells, and quantification of lane intensities normalized to GAPDH. (f) Western blots of phospho-Akt, total Akt and GAPDH in lysates of Dr-FGFR1-transfected PC6–3 cells, and quantification of lane intensities normalized to GAPDH. In (d)-(f) cells transfected with Dr-FGFR1 were either kept under 660 nm light, activated for 1, 5 or 10 min with 780 nm light, or did not contain Dr-FGFR1 (negative control). 25 μM BV was added to culture medium in all experiments. Error bars represent s.d., n=3 experiments.
