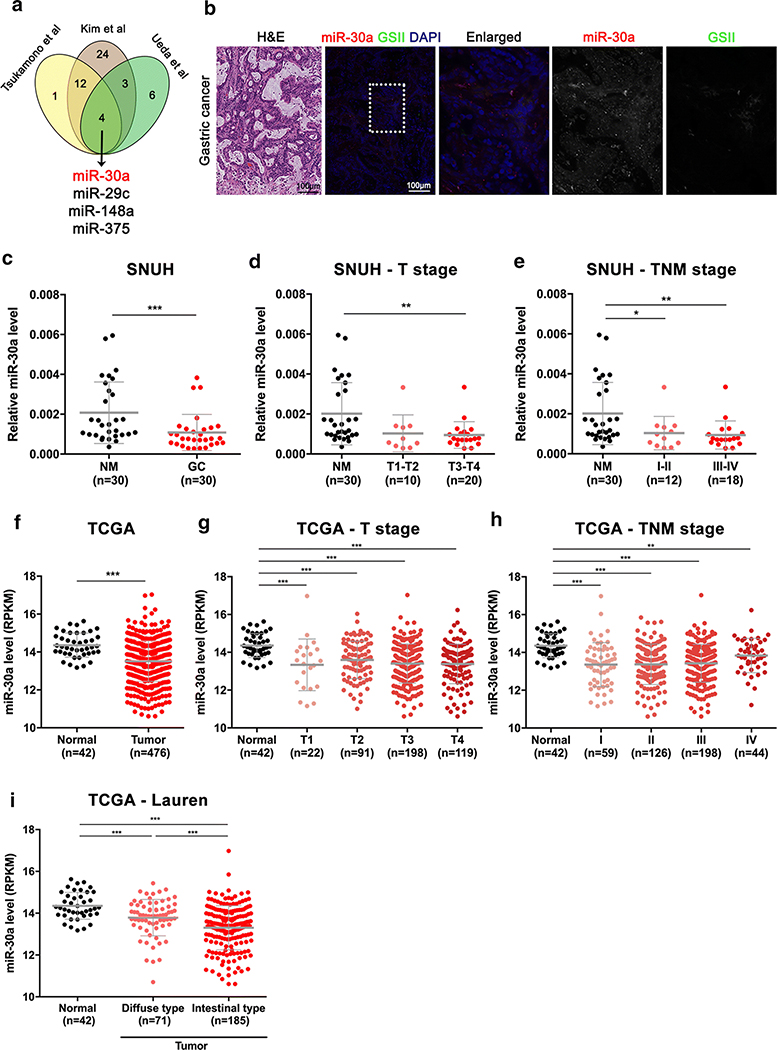
Figure 2. Expression level of miR-30a in GC.
(A) Identification of downregulated miRNAs in GC in three independent miRNA profiles which have been previously reported [10, 15, 16]. (B) In situ hybridization for miR-30a (red) and immunofluorescence staining for GSII (green) and DAPI (blue) in human GC tissue. Scale bar = 100 μm. Dotted box indicates enlarged area. (C-E) Expression level of miR-30a in 30 pairs of GC and adjacent non-cancer mucosa (NM) (C) and in NM and GC according to T stage (D) and TNM stage (E); samples were obtained from the Seoul National University Hospital (SNUH). (F-H) Expression status of miR-30a in 42 normal stomach tissues and 476 gastric adenocarcinoma samples (F) according to T stage (G) and TNM stage (H) from RNA sequencing data (Illumina GA, HiSeq) of TCGA. (I) miR-30a expression patterns according to Lauren classification in TCGA. *p < 0.05, **p < 0.01, ***p < 0.001, t-test

