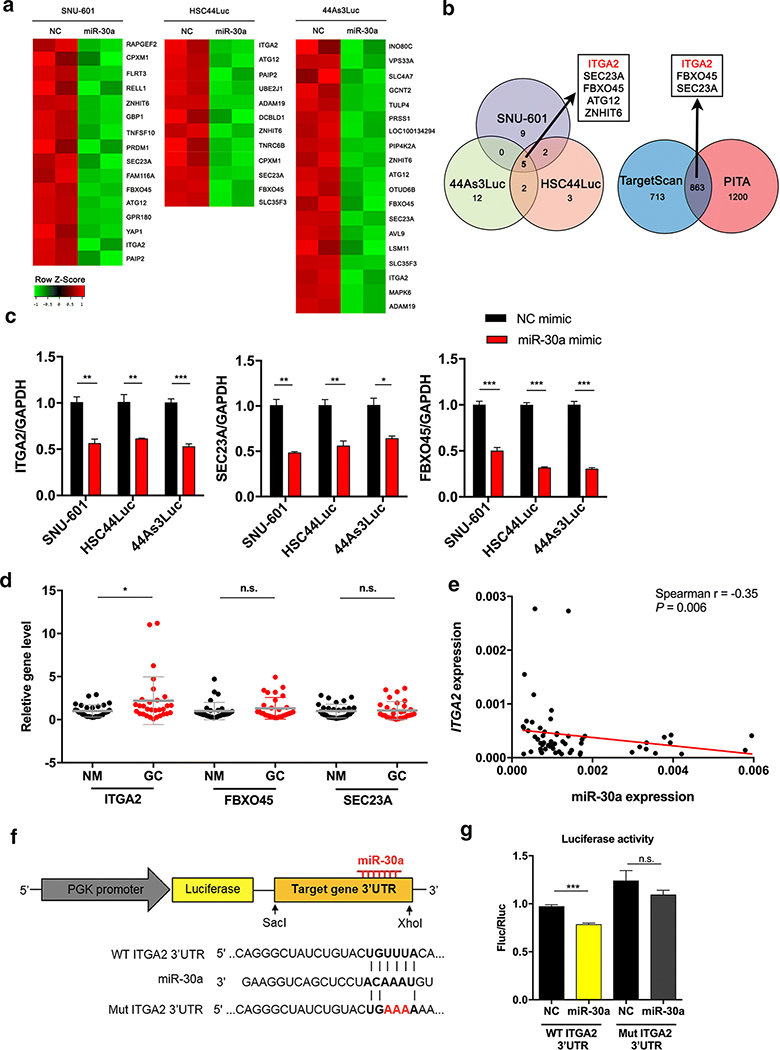
Figure 4. Microarray-based identification of ITGA2 as a miR-30a target gene.
(A) Heat map for downregulated genes in miR-30a mimic-treated cells (miR-30a) compared to NC mimic-treated cells (NC) in SNU-601, HSC44Luc and 44As3Luc cells. The samples were prepared in duplicate. (B) Venn diagram showing the overlapping downregulated genes between three miR-30a mimic-treated cells compared to NC mimic-treated cells (left). Using two miRNA target gene prediction programmes, we identified whether these genes have miR-30a binding sites, and the overlapping genes that have miR-30a binding sites are indicated in a Venn diagram (right). (C) Validation of expression levels of ITGA2, SEC23A and FBXO45 in either NC mimic- or miR-30a mimic-treated cell lines. (D) Analysis of ITGA2, FBXO45 and SEC23A expression in 30 pairs of GC tissues (GC) and adjacent non-cancer mucosa (NM) using qRT-PCR. (E) Correlation between miR-30a and ITGA2 expression in SNUH tissues. The red line represents the linear regression line. (F) Reporter constructs containing the wild-type (WT) or the mutant (Mut) of ITGA2 3’ UTR. (G) A luciferase reporter assay showed direct binding of miR-30a to the WT ITGA2 3’ UTR but not the Mut sequences. Fluc, firefly luciferase; Rluc, Renilla luciferase (right). *p < 0.05, ** p <0.01, *** p < 0.001, n.s., not significant. t-test.

