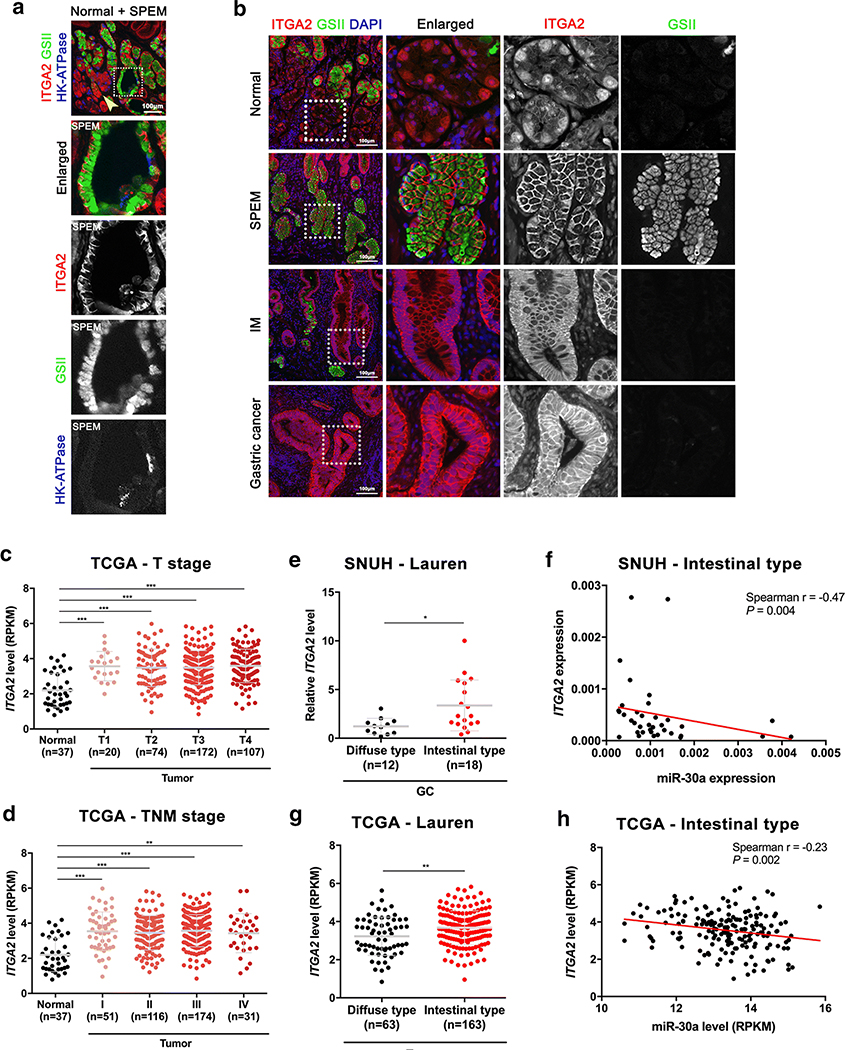
Figure 6. ITGA2 expression in human GC.
(A) Immunofluorescence staining for ITGA2 (red), GSII (green) and HK-ATPase (blue) in human normal donor stomach tissue includes normal and SPEM glands side-by-side. Scale bar = 100 μm. Yellow arrow indicates normal glands. Dotted boxes indicate an enlarged SPEM gland. (B) Immunofluorescence staining for ITGA2 (red), GSII (green) and DAPI (blue) in human GC patient tissues, including normal, SPEM, IM and GC regions. Scale bar = 100 μm. Dotted boxes indicate enlarged area. (C-D) ITGA2 expression levels in normal versus tumor samples according to T stage (C) and TNM stage (D) in TCGA data. (E-F) ITGA2 expression levels according to Lauren classification (E) and correlation with miR-30a expression levels in the intestinal type of GC (F) in SNUH cohort. (G-H) ITGA2 expression levels according to Lauren classification (G) and correlation with miR-30a expression levels in the intestinal type of GC (H) in TCGA cohort. The red line represents the linear regression line. *p < 0.05, ** p < 0.01, *** p < 0.001, unpaired t-test.

