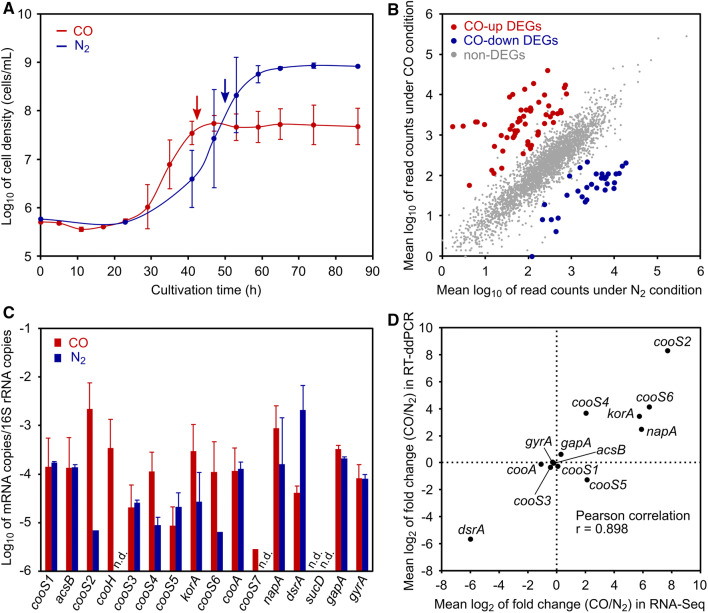
Fig. 1.
Overview of RNA-seq and RT-ddPCR datasets. a Growth curves of C. maritimus KKC1 in the presence (red) or absence (blue) of CO. The mean values of log10-transformed cell densities are plotted. Error bars indicate the standard deviation from three biological replicates. b Plots of read counts from genes in the presence or absence of CO. The mean values of log10-transformed read counts from two biological replicates are plotted. Upregulated DEGs in the presence of CO, downregulated DEGs, and non-DEGs are colored red, blue, and gray, respectively. c mRNA quantification by RT-ddPCR. The mean values of log10-transformed relative abundances of mRNA relative to 16S rRNA are shown. Values below the lower detection limit were omitted, although all samples were quantified with three biological replicates. Error bars indicate the standard deviation only when at least two values were above lower detection limit. d Comparison of fold-change values between RNA-seq and RT-ddPCR data. The mean values of log2-transformed fold changes of each gene are plotted. n.d. not detected

