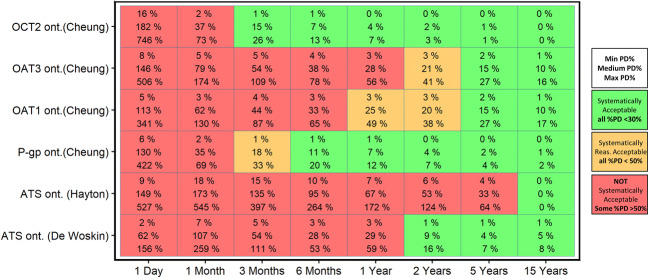
Fig. 4.
Percentage prediction difference (%PD) between CLR predictions obtained with the pediatric PBPK model that does not include transporter ontogeny (ontT = 1, reflecting adult values) and the model that includes age-specific pediatric ontT values for each of the indicated transporter systems. In each box, the minimum (top), median (middle), and maximum (bottom) %PD is displayed to summarize the findings for all hypothetical drugs per typical pediatric individual at different ages. Systematically acceptable scenarios have %PD for all drugs < 30% (green box), reasonable acceptable scenarios have %PD for all drugs ≤ 50% (orange box), and the absence of systematic acceptance means that at least one drug has a %PD > 50% (red box)

