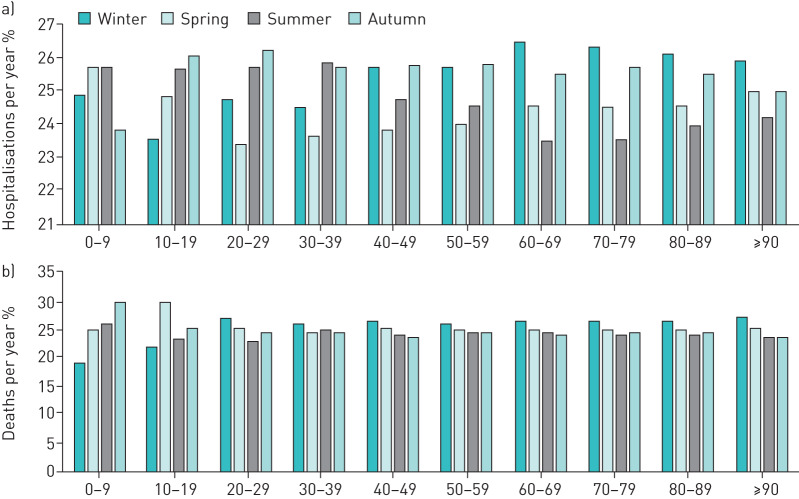
FIGURE 3.
a) Seasonal proportion of numbers of pulmonary embolism (PE) (cumulative 2005–2015) in the different age-decades (sum of seasonal percentages in each age-decade is 100%). b) Seasonal proportion of deaths (cumulative 2005–2015) in the different age-decades (sum of seasonal percentages in each age-decade is 100%).

