
Figure 2.
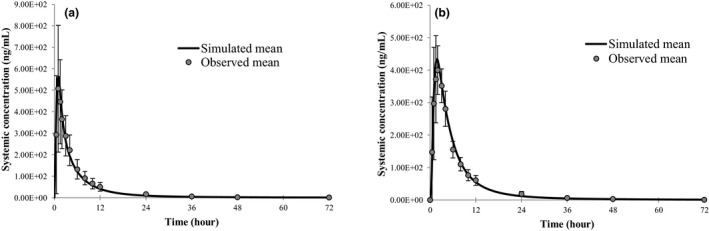
Observed and simulated plasma concentration‐time profiles of fenebrutinib after oral administration of fenebrutinib. (a) Administered 200 mg tablet under fasted and (b) 200 mg under fed state in healthy subjects.
Official websites use .gov
A
.gov website belongs to an official
government organization in the United States.
Secure .gov websites use HTTPS
A lock (
) or https:// means you've safely
connected to the .gov website. Share sensitive
information only on official, secure websites.
Observed and simulated plasma concentration‐time profiles of fenebrutinib after oral administration of fenebrutinib. (a) Administered 200 mg tablet under fasted and (b) 200 mg under fed state in healthy subjects.