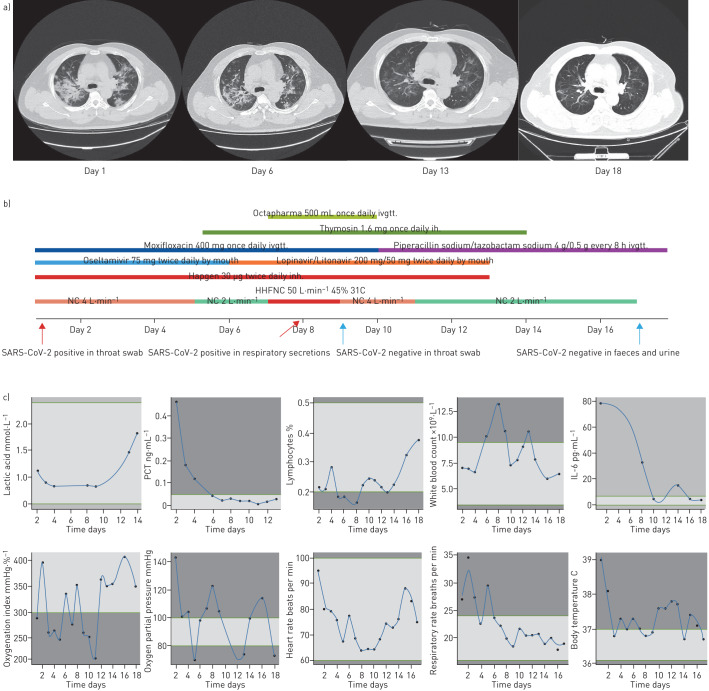
FIGURE 1.
Treatments and test results. a) Computed tomography results on days 1, 6, 13 and 18. b) Drug treatments and RT-PCR test results along. c) Patient status tracking during treatment, including lactic acid level, procalcitonin (PCT) level, lymphocyte percentage value, white blood cell count, interleukin (IL)-6 level, oxygenation index level, oxygen partial pressure, heart rate, respiratory rate and body temperature. Green lines represent the limits of normal values and light shading represents the normal range. HHNFC: humidified high-flow nasal cannula; NC: nasal cannula; ivgtt: intravenous glucose drip; ih: hypodermic injection; inh inhalation.

