Fig. 3.
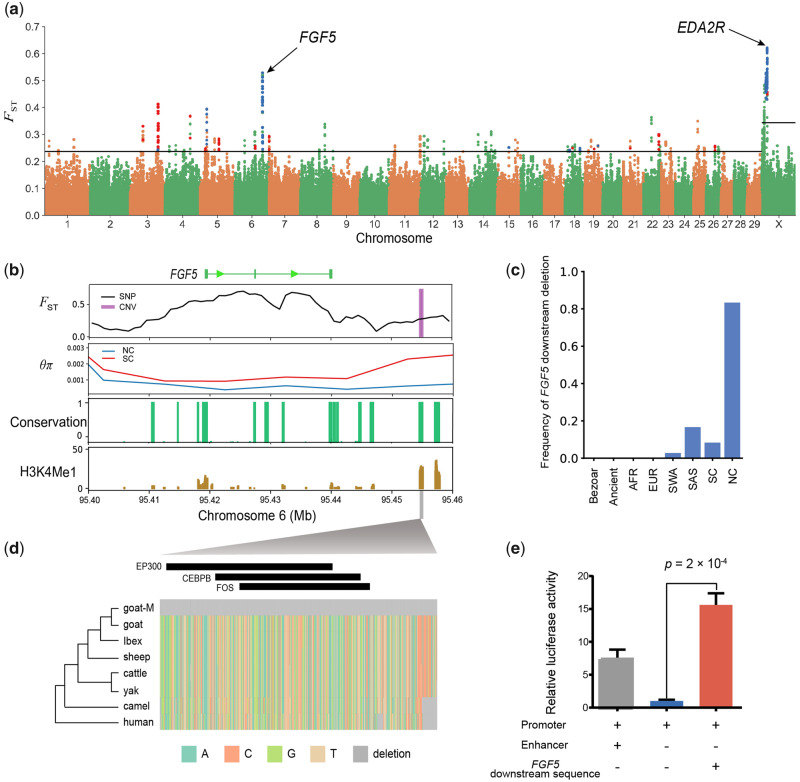
Genome-wide selection scan. (a) Manhattan plot of the genome-wide distribution of pairwise FST between SC and NC using a 50-kb window size and a 10-kb step size. The threshold of FST values is marked with a horizontal line. Windows selected in NC and SC are colored in blue and red, respectively. (b) Selection signs around FGF5. FST based on single nucleotide polymorphisms (SNPs) is plotted as a line using a nonoverlapping 10-kb sliding window. FST based on copy number variants (CNVs) is plotted as a rectangle. The conservation scores of 100 vertebrate species are shown in green, and H3K4Me1 signals are shown in brown. (c) The frequency of the 504-bp deletion (chromosome 6: 95,454,685–95,455,188 bp) in each population. (d) Sequence context of the 504-bp deletion in different species, showing deletion solely in the goat-mutant (goat-M) type. The black rectangles indicate transcription factor binding sites. (e) Dual-luciferase assay using goat fibroblasts showing that the FGF5 downstream deletion sequence enhanced the activity of luciferase. Data are shown as the mean ± standard error. The P-value was calculated using Student’s t-test.

