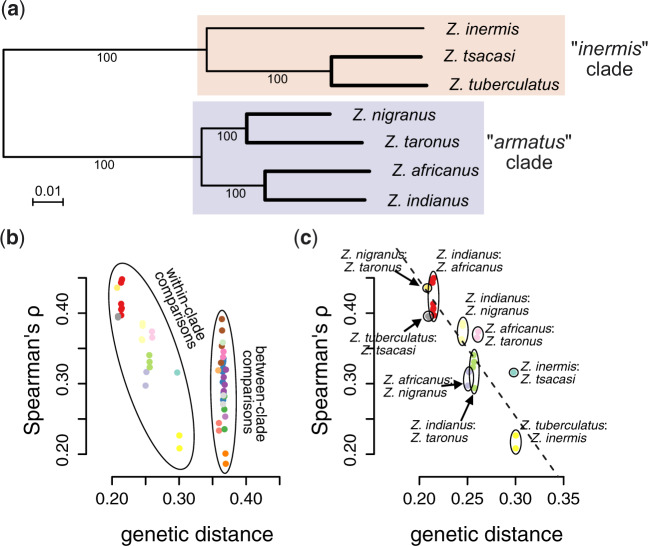
Fig. 5.
The correlation of genetic diversity (S) across the genomes of different species (a) decreases with increasing genetic distance (b and c). Maximum likelihood phylogeny in (a) was estimated with RAxML run on an alignment of 1,709 BUSCO genes annotated across all seven species’ genomes. Correlation coefficients decreased with increasing genetic distance (Mantel r = −0.816; b), with this pattern being particularly evident for within-clade comparisons (highlighted in c).

