Fig. 1.
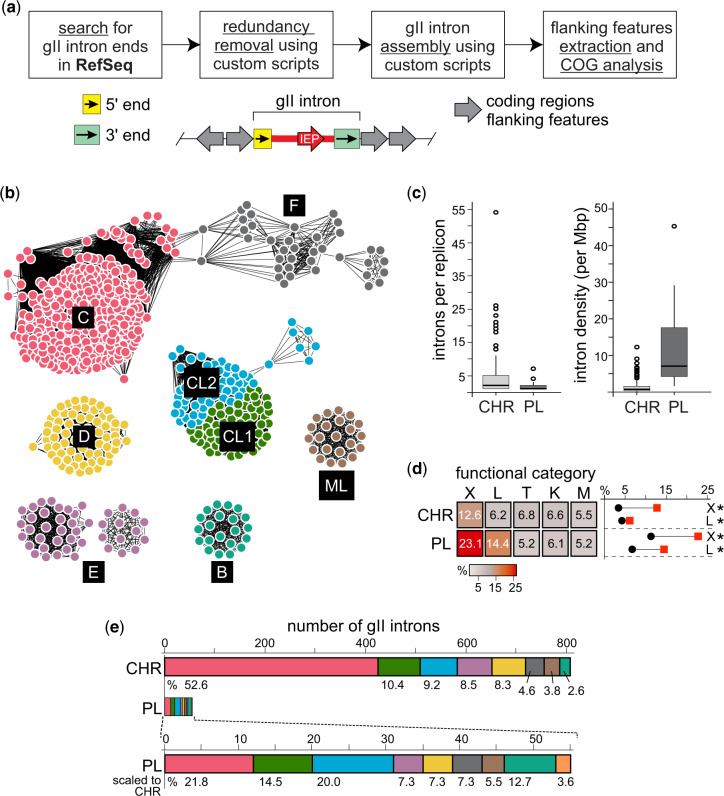
Group II intron mining pipeline and results. (a) Simplified workflow for mining gII introns. Semiconserved, class-specific 5′ and 3′ features were used to query the RefSeq database to identify boundaries for gII introns (green and yellow boxes). These boundaries were used to locate and assemble introns (red), the corresponding intron-encoded proteins (IEPs), and two flanking features on each end (gray arrows showing orientation). Redundant (identical) introns were removed prior to retrieving flanking features. For more details, see supplementary figure S1, Supplementary Material online. (b) Sequence similarity network (SSN) of gII IEPs. IEPs identified from mining gII introns were used to produce a SSN, which clusters proteins based on degree of similarity (Gerlt et al. 2015). Each protein is represented by a node (circles) and similarity is denoted by lines connecting nodes. Clusters are colored according to the class of IEP that composes each cluster. Class A is not shown because we were unable to identify IEP sequences in the two class A introns in our data set. (c) Group II intron distributions by replicon type. Boxplots showing the number (left) and density (right, introns per megabase pair, Mb) of introns per replicon, for chromosome (CHR) or plasmid (PL). The line within the box represents the median, whereas the box represents the interquartile range. Empty circles represent outliers. Numerical values are in supplementary table S6, Supplementary Material online, with source data in supplementary table S4, Supplementary Material online. (d) Functional (COG) distribution of gII intron neighborhoods by replicon type. Heat map comparing the relative abundance of COG categories in gII intron flanking features per chromosome (CHR) and plasmid (PL). Intensity of the heatmap shows relative percentage of each category. Only top five categories are shown on the heatmap, with the full analysis in supplementary figure S3a, Supplementary Material online and a key for all COG categories in supplementary table S7, Supplementary Material online. To the right of the heatmap are plots representing the difference between relative COG abundance in gII intron neighborhoods (red squares) and the background replicon COG abundance (black circles) for COG categories X and L. Asterisks represent statistical significance at P < 0.001, calculated using a hypergeometric test as in Toft et al. (2009). COG categories shown here: X—mobile genetic elements (MGEs); L—DNA replication, recombination, and repair (RRR); T—signal transduction; K—transcription; M—membrane or cell wall-related. (e) Distribution of intron classes. Shown are a comparison of the number of introns per class on chromosomes (CHR) or plasmids (PL). Colors correspond to intron classes as in (b) except for class A (not pictured in b), which is orange. Also shown is the enlarged representation of plasmid introns for comparison. Numbers below the bars represent the relative abundance (percentage) of introns detected from each class. For details, see supplementary figure S5, Supplementary Material online and supplementary table S5, Supplementary Material online.

