Fig. 2.
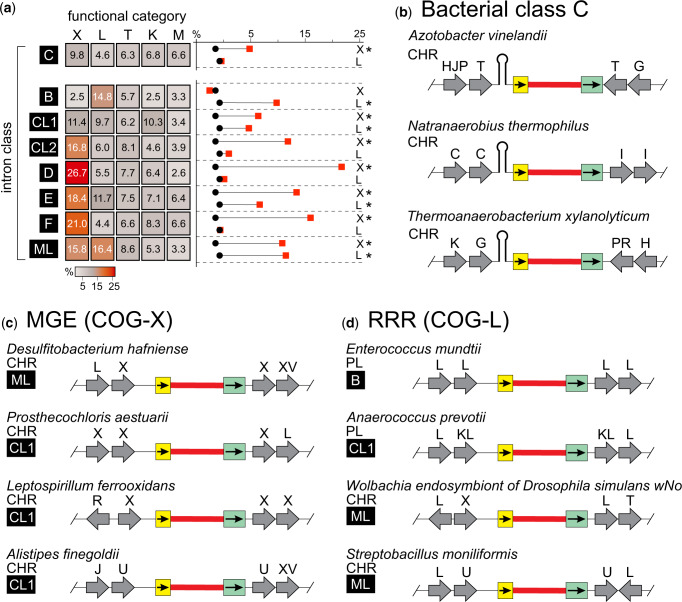
Group II introns occupy distinct functional neighborhoods. (a) Group II intron neighborhood COG distribution breakdown by class, where the heatmap color represents the percent relative abundance of each category within a class. Only the top five categories are shown, but the full analysis can be found in supplementary figure S3b, Supplementary Material online and supplementary table S12, Supplementary Material online. Class A was omitted from this heatmap due to the small number of class A gII introns. To the right of the heatmap are plots representing the difference between relative COG abundance in gII intron neighborhoods (red squares) and the background COG levels from all replicons that contain gII introns (black circles). Asterisks represent statistical significance at P < 0.001, calculated using a hypergeometric test as in Toft et al. (2009). (b) Representative neighborhoods for class C introns. Class C introns show a great variety in functional neighborhoods, likely due to their mechanistic requirement for insertion after transcription terminators (stem-loop). For details on each neighborhood, see supplementary table S11, Supplementary Material online. (c) Representative neighborhoods containing mobile genetic elements (MGE) from COG-X. For details, see supplementary table S15, Supplementary Material online. (d) Representative neighborhoods from COG-L containing replication, recombination, and repair functions (RRR). For details, see supplementary table S17, Supplementary Material online. Relevant COG category key: X—mobile genetic elements (MGEs); L—DNA replication, recombination and repair (RRR); T—signal transduction; K—transcription; M—membrane or cell wall-related; C—energy production and conversion; G—carbohydrate transport and metabolism; H—coenzyme transport and metabolism; I—lipid transport and metabolism; J—translation, ribosomal structure, and biogenesis; P—inorganic ion transport and metabolism; R—general function prediction only; U—intracellular trafficking, secretion, and vesicular transport; V—defense mechanisms. All other categories are described in supplementary table S7, Supplementary Material online. If a gene is represented by more than one COG category, multiple letters are listed. All diagrams are labeled as in figure 1a. The functional COG categories are labeled above gray arrows representing each feature.

