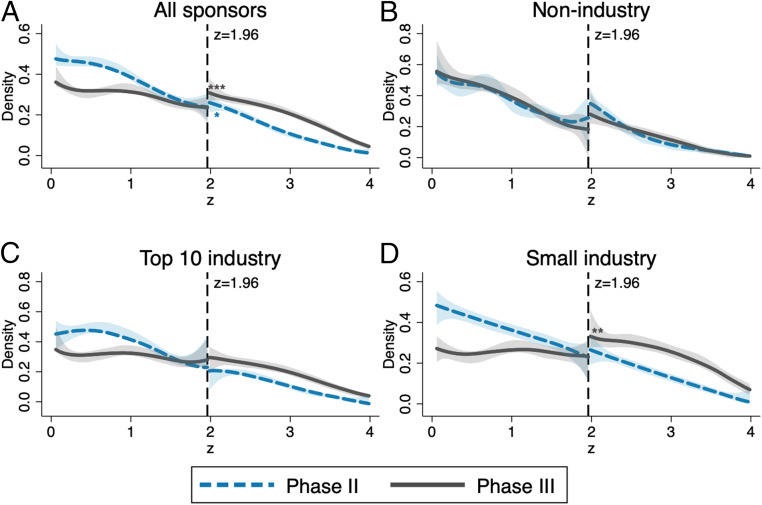
Fig. 1.
Comparison of phase II and phase III densities of the z score and tests for discontinuity at , depending on the affiliation of the lead sponsor. Density estimates of the constructed z statistics for primary outcomes of phase II (dashed blue lines) and phase III (solid gray lines) trials are shown. The shaded areas are 95% confidence bands, and the vertical lines at 1.96 correspond to the threshold for statistical significance at the 0.05 level. Sample sizes: (phase II), (phase III) (A); (phase II), (phase III) (B); (phase II), (phase III) (C); and (phase II), (phase III) (D). Significance levels for discontinuity tests (38) are shown. **P < 0.05; ***P < 0.01. Exact P values are reported in SI Appendix, Table S2.

