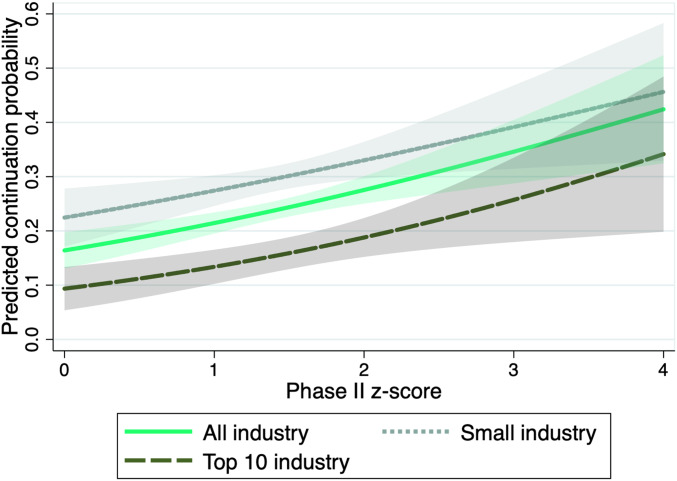
Fig. 3.
Predicted continuation probability as function on the phase II z score, depending on affiliation of lead sponsor. Predictions are based on the estimated logit selection functions for selective continuation; see Table 1 for the estimated coefficients. All control variables are fixed at their mean values. The shaded areas are 95% confidence bands.

