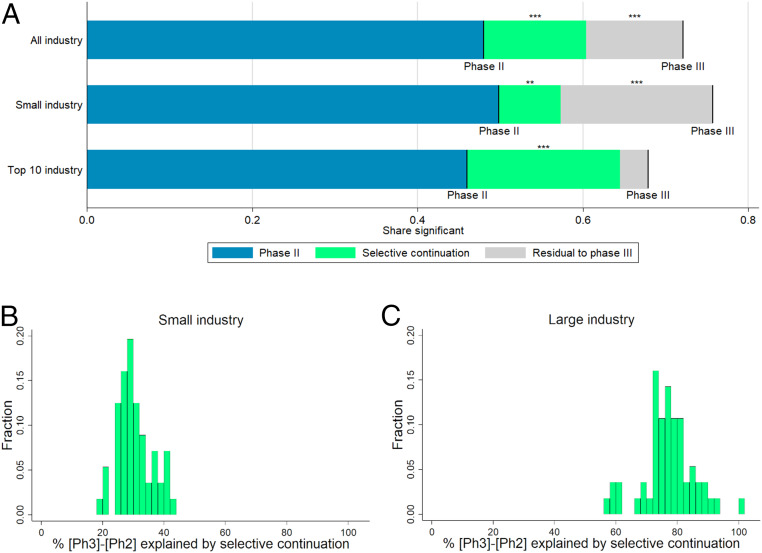
Fig. 4.
(A) Selection-based decomposition of the difference in significant results from primary outcomes between phase II and phase III, depending on affiliation of lead sponsor (top-10 revenues criterion). Phase II and III lines represent the shares of trials with a P value below 5% (or, equivalently, a z score above 1.96). The green segments represent the parts of the differences explained by selective continuation, based on counterfactuals constructed from the phase II distribution. For precise numbers and sample sizes, see SI Appendix, Table S7. Significance levels for the differences (based on a two-sided t-test) are indicated. **P < 0.05; ***P < 0.01. (B and C) Histograms of the percentage share of the difference in the share of significant results between phase III and phase II explained by selective continuation across different definitions for large vs. small industry sponsors. The shares correspond to the green area in A divided by the sum of the green and the gray areas. The sample of industry-sponsored trials is split according to 56 different definitions of large sponsors. These definitions are obtained by ranking sponsors by their 2018 revenues, volume of prescription drug sales in 2018, research and development spending in 2018, and the number of trials reported to the registry. For each of these four criteria, 14 different definitions of “large vs. small” were created: top seven vs. remainder, top eight vs. remainder, and so on, up to top 20 vs. remainder. Further details are provided in SI Appendix.

